Enjin Coin (ENJ/USD) Bulls Reclaim the $0.250 Price Level
Estimated Reading Time: 3 minutes
Don’t invest unless you’re prepared to lose all the money you invest. This is a high-risk investment and you are unlikely to be protected if something goes wrong. Take 2 minutes to learn more
The $0.250 price level has played a pivotal role in the Enjin Coin market’s dynamics since the start of the year, representing a significant point of reference from the inception of the first bull market of the year. This initial bull run, stemming from the $0.250 price mark, reached its peak at $0.572 on February 24 before giving way to a bearish trend. Subsequently, the bear market revisited the $0.250 support level in mid-June; however, due to the substantial selling pressure, the market sought a support level beneath $0.250. This strategic move ultimately facilitated a reversal of the market’s trajectory toward a bullish direction.
Enjin Coin Market Data
- ENJ/USD Price Now: $0.273
- ENJ/USD Market Cap: $257,793,651
- ENJ/USD Circulating Supply: 1,000,000,000 ENJ
- ENJ/USD Total Supply: 1,000,000,000 ENJ
- ENJ/USD CoinMarketCap Ranking: #110
Key Levels
- Resistance: $0.300, $0.350, and $0.400.
- Support: $0.22, $0.21, and $0.20.
Enjin Coin Price Forecast: Analyzing the Indicators
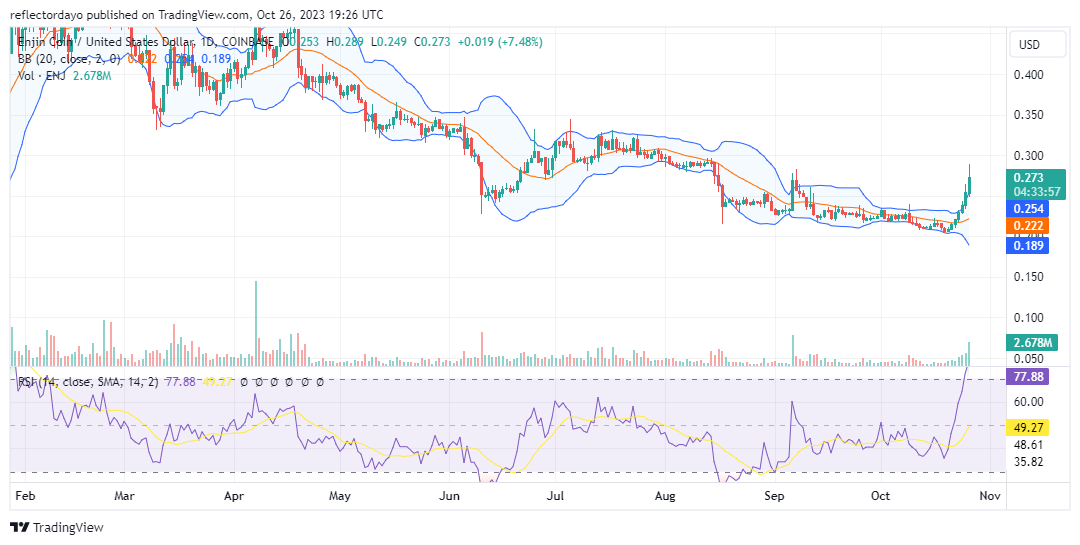
As the Enjin Coin market gains significant upward momentum, the divergence of the Bollinger Bands underscores the strength of the current bullish movement. The potential for this movement to evolve into a sustained trend hinges on the ability of the bulls to establish a robust support level capable of sustaining market momentum. On October 21, traders began to congregate around the $0.200 price threshold, which subsequently facilitated a noteworthy ascent, propelling the market beyond the pivotal $0.250 price level and edging closer to the $0.300 threshold. Nevertheless, around this juncture, profit-taking among traders initiated a retracement back toward the critical $0.250 price level.
Analyzing the volume of trade indicators reveals that the histograms exhibit a continuous and formidable increase. This robust trading volume bolsters traders’ confidence in the ongoing bullish market sentiment. The likelihood of the trend’s continuation remains contingent on the bulls’ ability to establish a pivotal support level at $0.250, thus warranting vigilant monitoring of this price level.
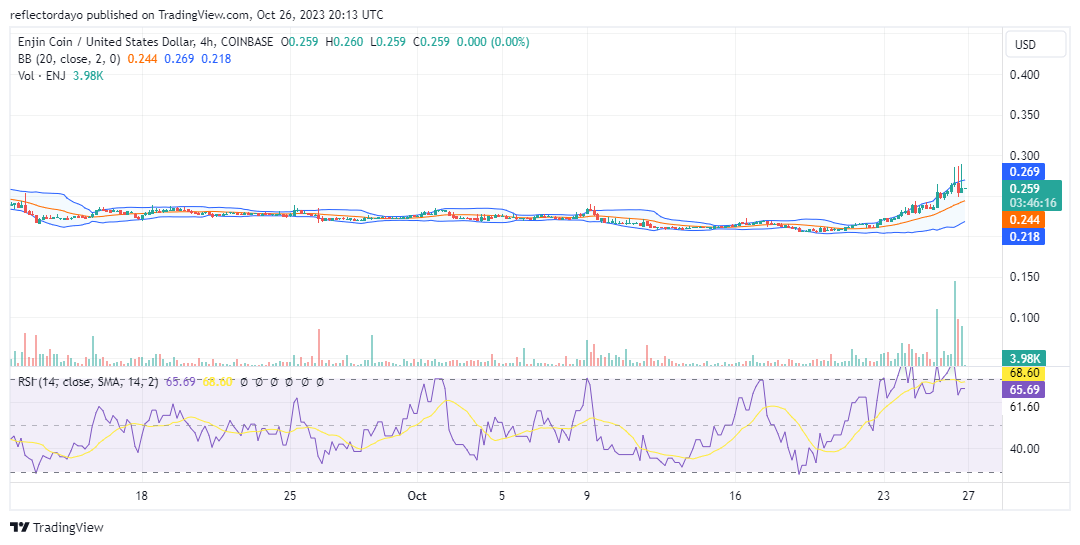
ENJ/USD 4-Hour Chart Outlook
Analyzing the 4-hour chart, the Bollinger Bands indicator has commenced depicting a bullish market. It is indicative of an upward-moving price channel characterized by widening bands. This expansion underscores the robustness of the current bull market, increasing the potential for a sustained bullish trend. Despite the presence of three recent candlesticks indicating strong resistance, as evidenced by their tall upper shadows, the prevailing indicator performance signals increasing momentum in the bullish market. This situation warrants close attention as the market dynamics evolve.