BNB (BNB/USDT) Gearing Up for More Upside Movement
Estimated Reading Time: 3 minutes
Don’t invest unless you’re prepared to lose all the money you invest. This is a high-risk investment and you are unlikely to be protected if something goes wrong. Take 2 minutes to learn more
BNB Long-term Analysis: Bullish
BNB against the Tether has been exhibiting a gradual trajectory recently, holding above support levels and pushing towards higher resistance lines. The market has been showing signs of bullish momentum, supported by positive gains as seen in the formation of higher highs.
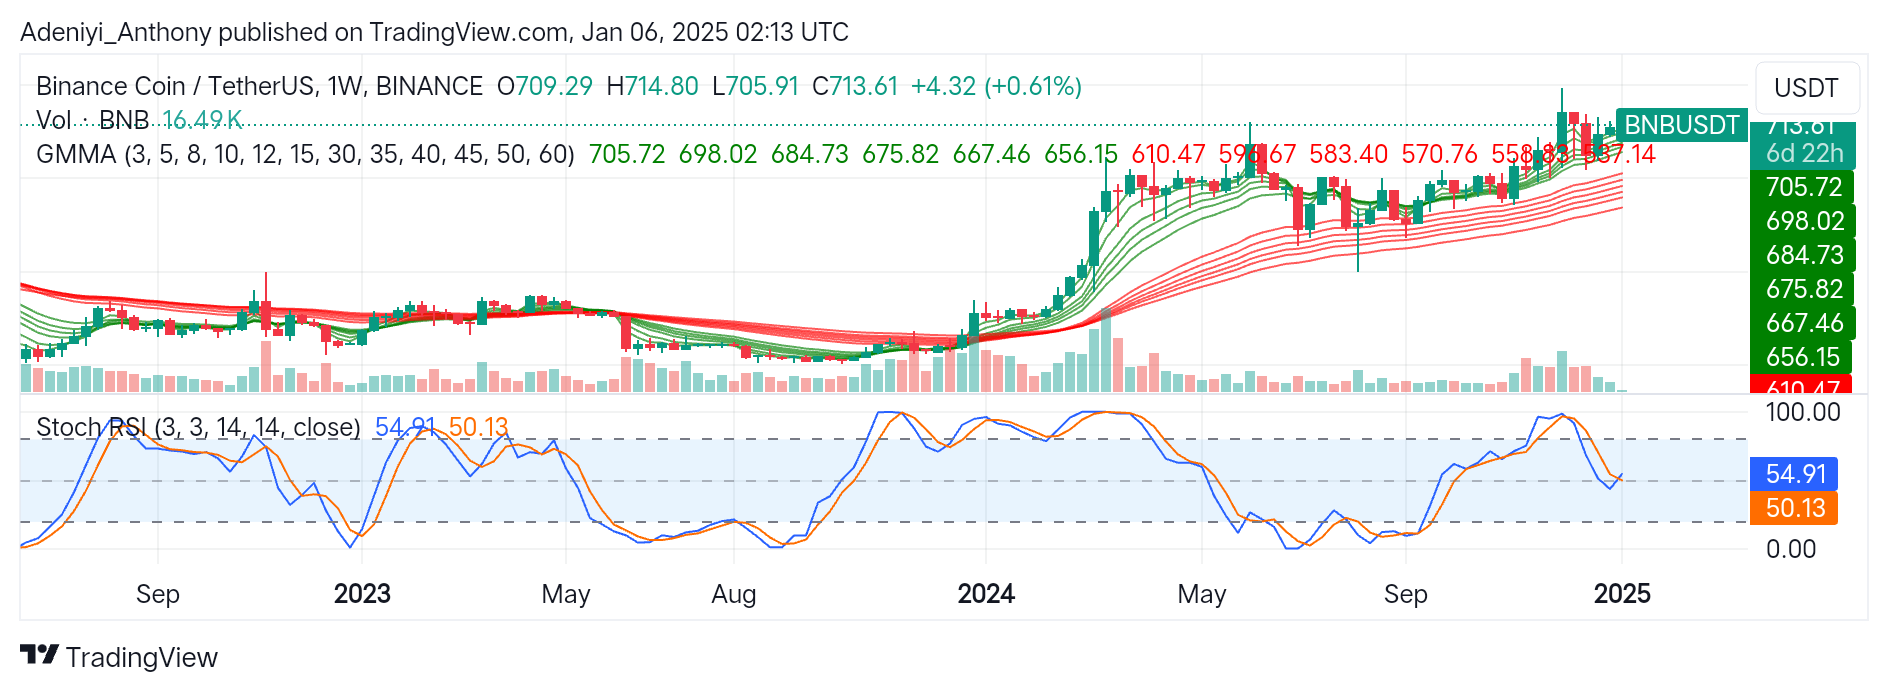
However, as BNB/USDT trends upward, recent price actions suggest continued upside movement as the price settles above the green Guppy Multiple Moving Averages (GMMAs), characterized by a noticeable gap within the two sets of Exponential Moving Averages (EMAs).
This action indicates a growing bullish momentum as the line behavior of the Stochastic RSI signals more improvement to the North.
Currently, BNB trades at $713.61, recording over 16 thousand traded volumes and a marginal weekly gain of 0.61% over the previous session.
Technical Indicators
Major Resistance Levels: $714.80, $750.00, and $780.00
Major Support Levels: $705.72, $698.02, and $675.82
BNB Technical Analysis
On the weekly timeframe, BNB against the Tether maintains a positive long-term outlook as price trends higher, reflecting increasing bullish support after every short-term price dip. However, the present setup suggests caution as the price of the pair trades above the GMMAs, signaling an overbought condition. Therefore, a pullback towards $705.72 before further gains aligns with the overall trend.
On the other hand, the Stochastic RSI suggests a neutral position for the pair. This signals more room for improvement but hints at a potential consolidation in the near term. However, a retracement towards $698.02 might be on the horizon if a bearish crossover of the lines occurs.
BNB/USDT Analysis: What’s Happening?
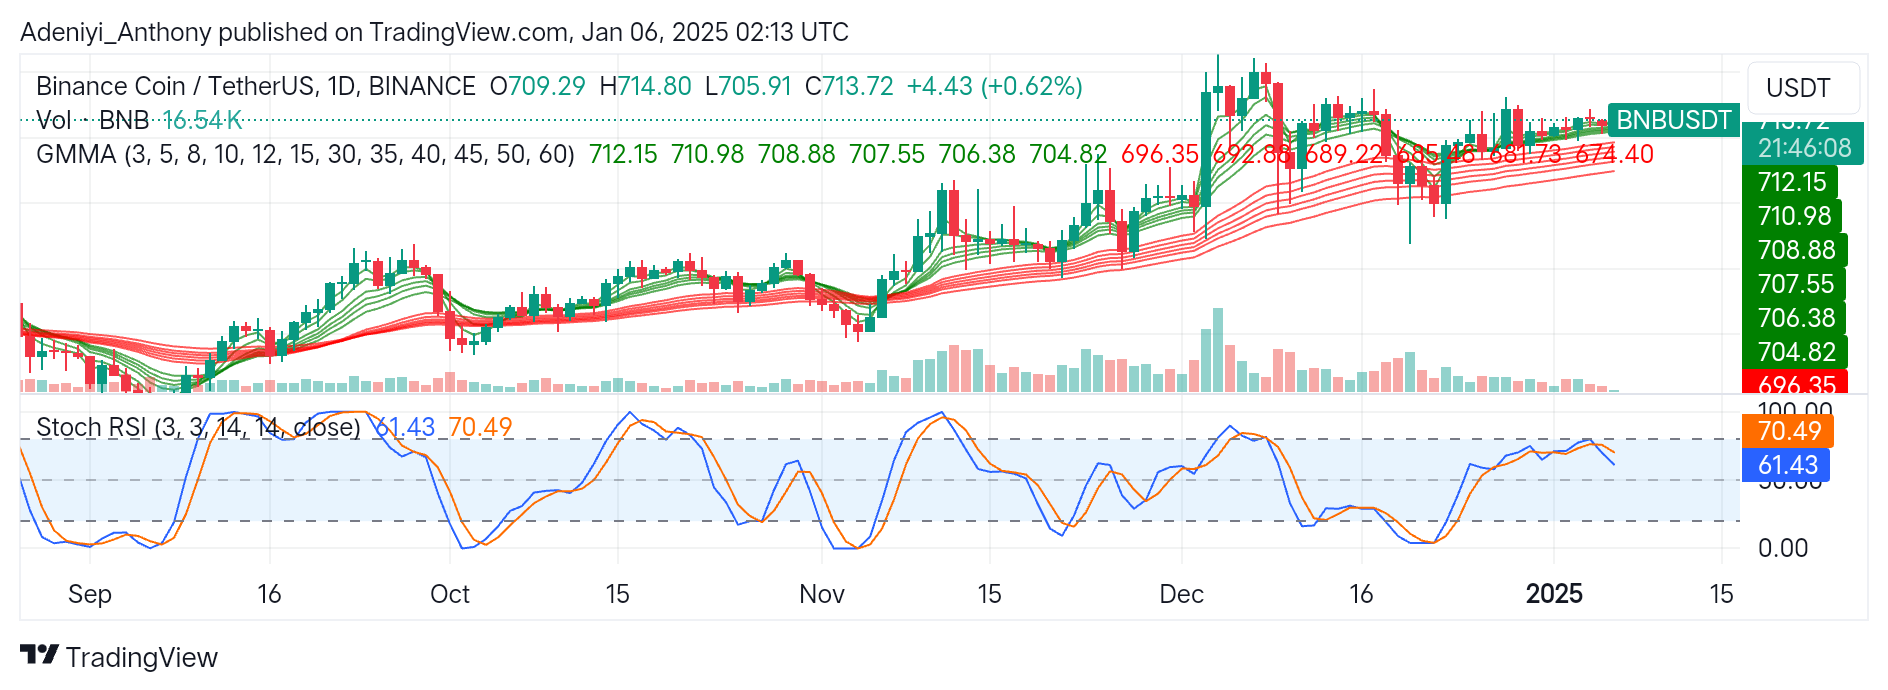
On the daily timeframe, BNB/USDT oscillates around the short-term EMAs, suggesting a consolidation phase as the market awaits a clearer sign. The position of the GMMAs, though aligns with the continuation of a bullish momentum with upside well-separated lines. However, as the price trades between $710 and $714 support and resistance levels, a sustained bullish momentum will push the price above the latter; otherwise, a break below $710 could lead to a retest of the $700 psychological level.
On the other hand, the oscillator indicates potential bearish momentum in the short term as the orange line crosses over the blue line. To this end, a pullback may occur unless momentum is strengthened. Therefore, if selling pressure increases, as indicated by the downward-facing oscillator, BNB/USDT could retest the $700 psychological level.
You can purchase crypto coins here. Buy LBlock