Cardano (ADA/USDT) Sees a Sharp Price Dip After Recent Rally
Estimated Reading Time: 3 minutes
Don’t invest unless you’re prepared to lose all the money you invest. This is a high-risk investment and you are unlikely to be protected if something goes wrong. Take 2 minutes to learn more
Cardano Long-term Analysis: Bullish
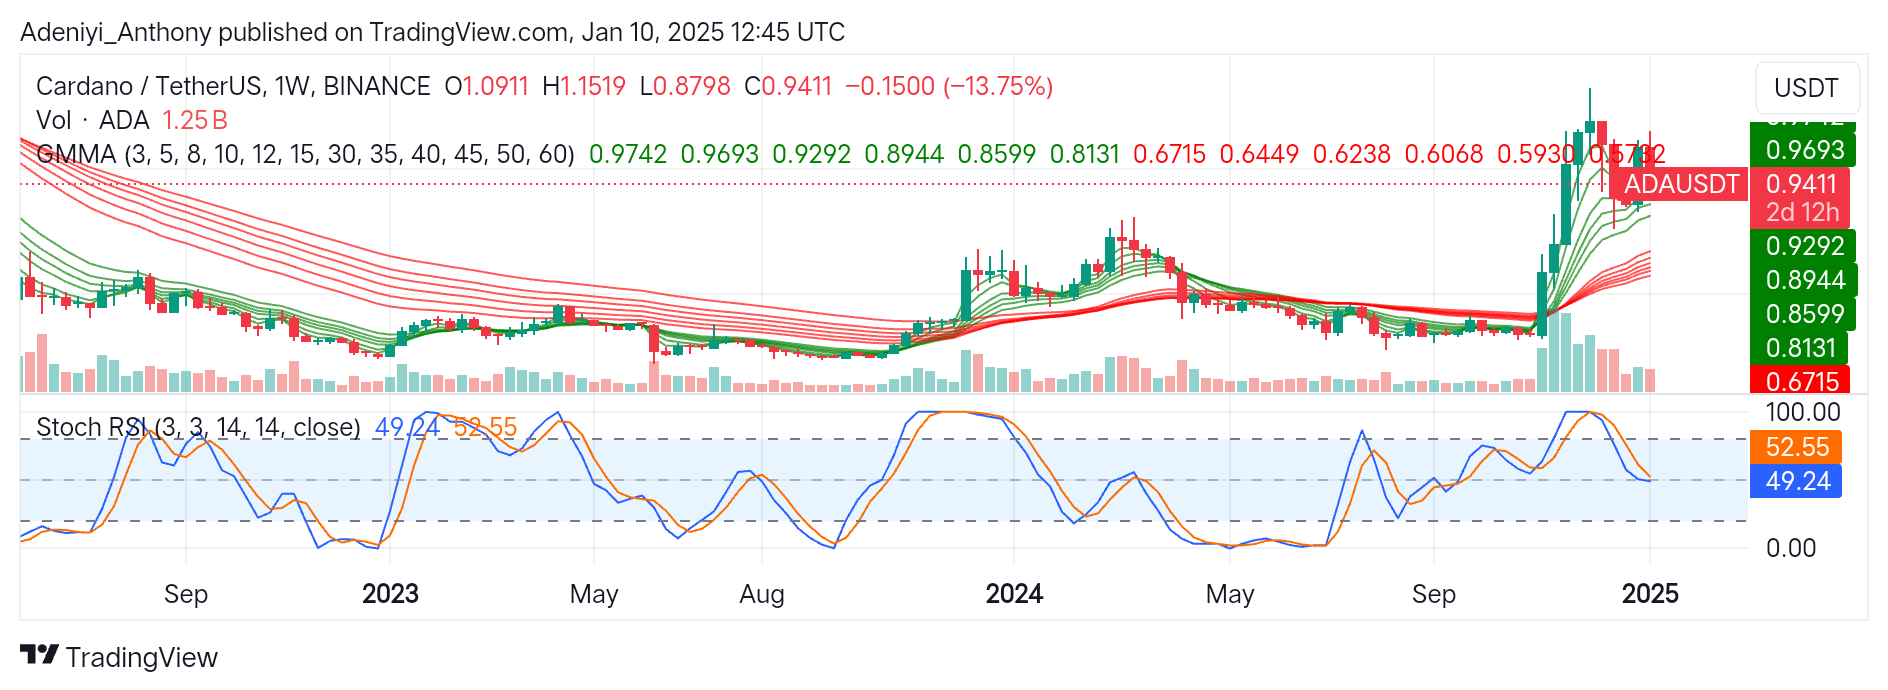
On a weekly timeframe, Cardano against the Tether appears to be retracing after a strong bullish rally. However, its appearance above key support levels shows the potential for the trend to continue in the near term.
Recently, the ADA/USDT market has experienced heightened volatility, reflecting broader crypto market sentiment. In 2024, it hit above $1.0000 before significantly dropping 13.75% this week. This pullback suggests strong profit-taking actions by short-term traders, as ADA may continue its uptrend soon.
At this juncture, ADA’s market participants are now monitoring critical levels, as an upward trajectory above the nearest resistance would suggest an uptrend resumption; otherwise, a further dip would propel the price toward support levels.
Currently, Cardano trades at $0.9411 with 1.25 billion weekly traded volumes.
Technical Indicators
Major Resistance Levels: $0.9693, $0.9742, and $1.0911
Major Support Levels: $0.9292, $0.8944, and $0.8599
Cardano Technical Analysis
The analysis for Cardano against the Tether shows a market that remains cautiously optimistic as traders await a decisive move in either direction. However, the price’s position and gap between the Guppy Multiple Moving Averages (GMMAs) signal an uptrend, as both sets of EMAs trend upward.
To this end, the Bulls must claim the immediate resistance level to regain momentum; otherwise, a break below $0.8944 would indicate a further dip.
On the other hand, the Stochastic RSI suggests the pair lacks direction as both lines read in the neutral zone. However, the current position of the Stochastic lines suggests the pair is preparing for a reversal in the near term.
ADA/USDT Analysis: What to Expect
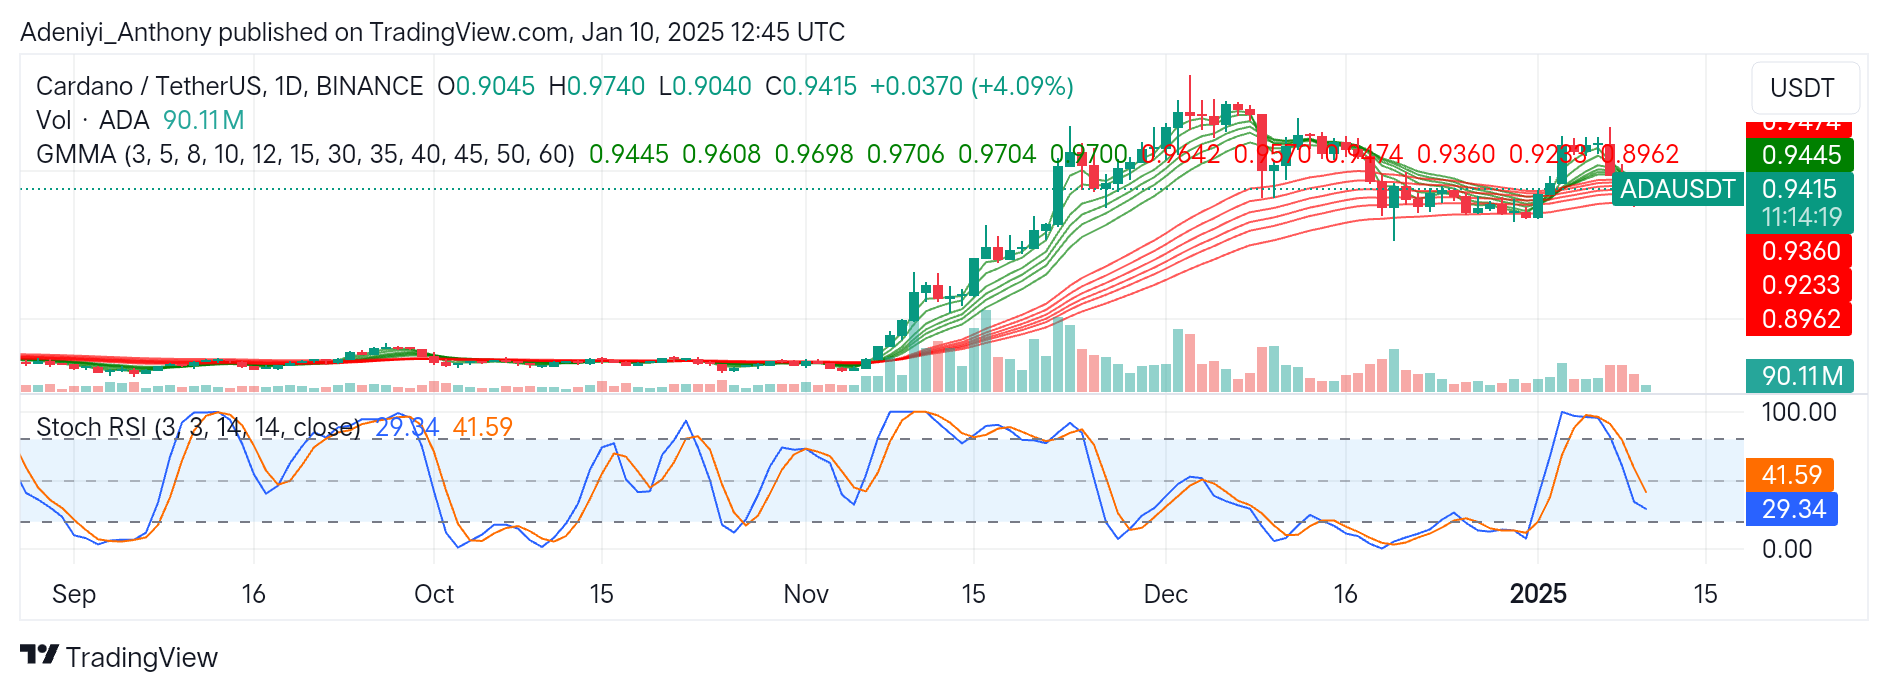
During the daily timeframe, ADA/USDT shows signs of recovery after a period of short-term correction. However, the narrowing and intersecting EMAs indicate reduced volatility or indecision in price in the near term.
On the other hand, the oscillator at the bottom of the chart suggests a slightly oversold condition for the pair. However, the upside curvature of the lines indicates a potential bullish momentum is building up.
To this end, for confirmation, the price needs to stay above $0.9693 for a reversal; otherwise, a drop below $0.8944 would suggest a downtrend.
You can purchase crypto coins here. Buy LBlock
