Chainlink (LINK) Is in a Tight Range, Fluctuates Between $25 and $28
Estimated Reading Time: 3 minutes
Don’t invest unless you’re prepared to lose all the money you invest. This is a high-risk investment and you are unlikely to be protected if something goes wrong. Take 2 minutes to learn more
Chainlink (LINK) Long-Term Analysis: Ranging
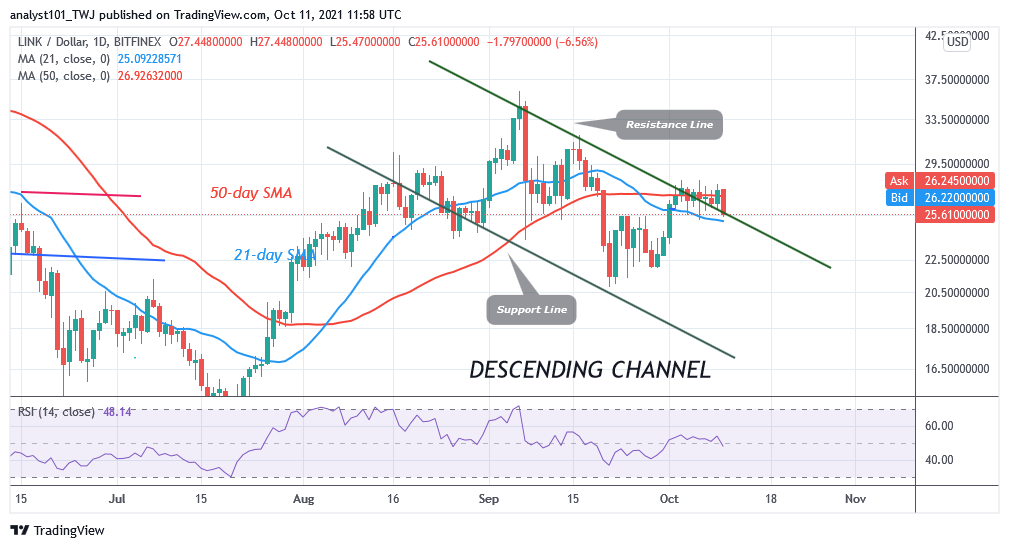
Chainlink’s (LINK) price is in a range-bound move since October 2. The crypto has been fluctuating between $25 and $28. The bulls have made concerted efforts to resume the uptrend but have been repelled at the $28 resistance zone. Presently, the Chainlink price is above 21-day line SMA but below the 50-day line SMA. This indicates that the altcoin will be in a downward correction. The LINK price is falling as it approaches the 21-da y line SMA. A break below the 21-day line SMA will compel LINK/USD to further decline on the downside. The range-bound move will resume if the 21-day line SMA support holds.
Chainlink (LINK) Indicator Analysis
LINK price is at level 48 of the Relative Strength Index period 14. Chainlink is in the downtrend zone and below the centerline 50. The altcoin is capable of falling in the downtrend zone. The downward correction will continue as long as the LINK price is confined between the 21-day line SMA and the 50-day line SMA. Chainlink is above the 25% range of the daily stochastic. It indicates that the market is in a bullish momentum.
Technical indicators:
Major Resistance Levels – $40.00, $42.00, $44.00
Major Support Levels – $26.00, $24.00, $22.00
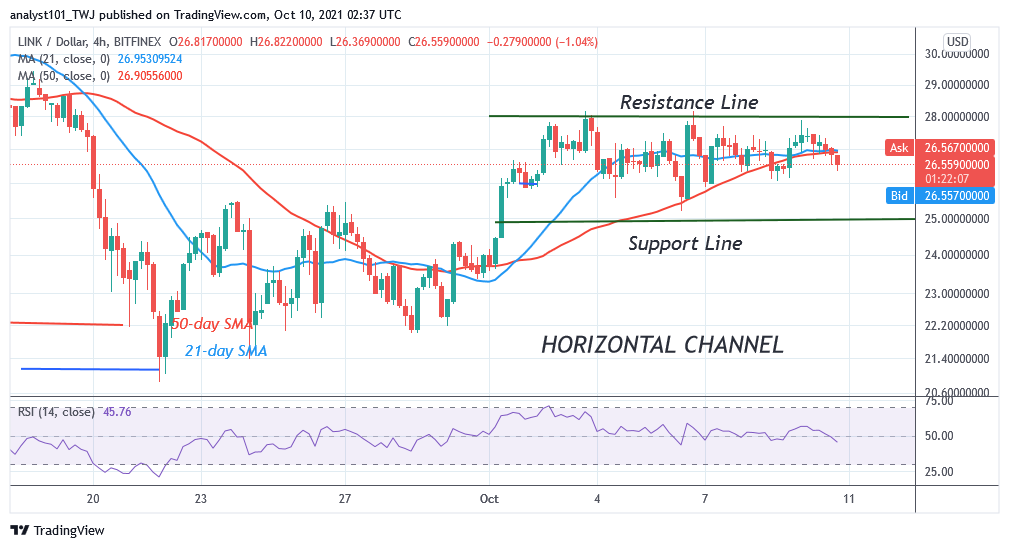
What Is the Next Direction for Chainlink (LINK)?
On the 4 hour chart, Chainlink is confined between $25 and $28 price levels. For the past week, the bulls and bears are yet to break the range-bound levels. A range-bound trader can initiate trade as price fluctuates in a range. As the Chainlink price rises, a trader can initiate a long order at the support level. This order can be exited at the $28 resistance zone. Similarly, a short-order can be initiated at the $28 resistance zone and exited at the support line.
You can purchase crypto coins here. Buy Token
Note: Cryptosignals.org is not a financial advisor. Do your research before investing your funds in any financial asset or presented product or event. We are not responsible for your investing results


