Livepeer (LPT/USD) Market Update: A Surge or a Return to Consolidation?
Estimated Reading Time: 3 minutes
Don’t invest unless you’re prepared to lose all the money you invest. This is a high-risk investment and you are unlikely to be protected if something goes wrong. Take 2 minutes to learn more

Earlier today, Livepeer (LPT) experienced a strong upward move, rallying from its opening price of around $6.70 to a session high near $9.00. However, after peaking at that level, the market corrected downward, retracing to approximately $7.30, a level situated just below the key $8.00 resistance zone.
So far, the intraday gain stands at roughly 11%, adding to the impressive 50% advance recorded this week. Yet, with the pullback bringing price action back to the $7.30 level, the critical question arises: is this the beginning of renewed consolidation, or merely a pause before the next leg upward?
Livepeer (LPT/USD) Market Data
- LPT/USD Price Now: $7.33
- LPT/USD Market Cap: $319 million
- LPT/USD Circulating Supply: 43.8 million LPT
- LPT/USD Total Supply: 43.8 million LPT
- LPT/USD CoinMarketCap Ranking: #156
Key Levels
- Resistance: $8.00, $9.00, and $10.00.
- Support: $6.00, $5.00, and $4.00
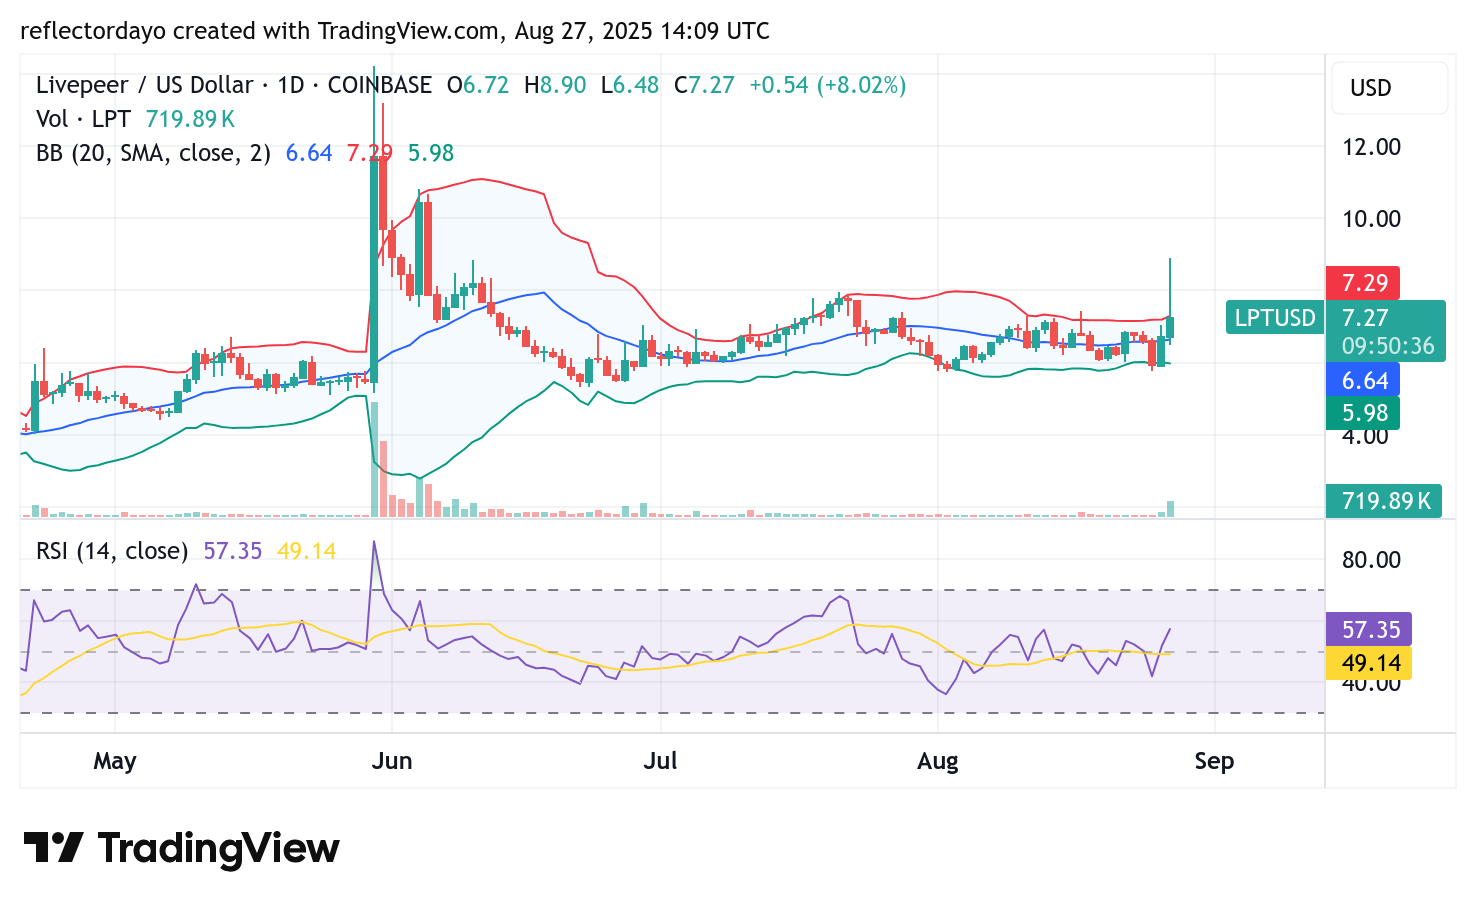
Daily Chart Outlook: Livepeer (LPT/USD)—A Surge or a Return to Consolidation?
Livepeer (LPT) delivered a strong rally in today’s session, climbing from its opening level of $6.70 to a peak near $9.00 before retracing toward the $7.30 resistance zone. The pullback reflects profit-taking following the sharp surge.
However, trading volume has not shown a significant spike, as the histogram remains relatively subdued—indicating that the bullish momentum may not be broadly supported by strong market participation. This suggests that only a few investors are driving the upside move.
At the $7.33 price level, price action is stabilizing, creating a pivotal point. A decisive upward surge from $7.33 could extend the rally, while a breakdown at this point would likely confirm a return to consolidation.

LPT/USD 4-Hour Chart Outlook
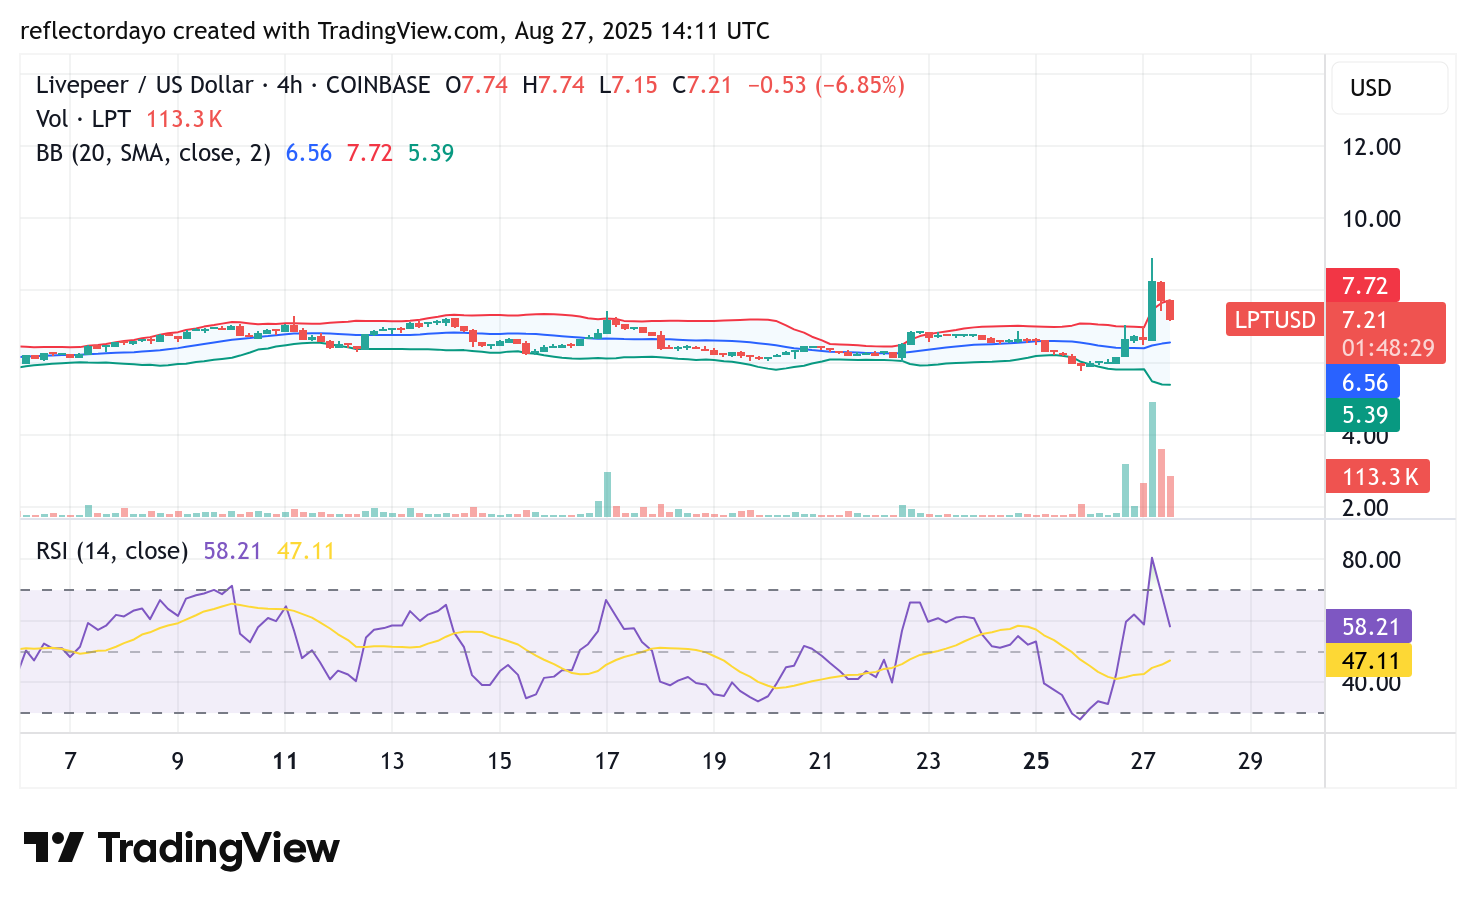
On the 4-hour timeframe, the Bollinger Bands indicate heightened market volatility, suggesting the potential for significant price swings. However, momentum appears to be fading as price approaches the critical $7.30 level.
Trading volume has started to decline near this zone, signaling that the market may be preparing to stabilize. A closer look reveals early signs of bearish rejection around this level, hinting that bullish momentum may be weakening as sellers begin to assert control.