Binance Coin Is in a Range but Risks a Drop to a Low of $294
Estimated Reading Time: 2 minutes
Don’t invest unless you’re prepared to lose all the money you invest. This is a high-risk investment and you are unlikely to be protected if something goes wrong. Take 2 minutes to learn more
Binance Coin (BNB) Long-Term Analysis: Bearish
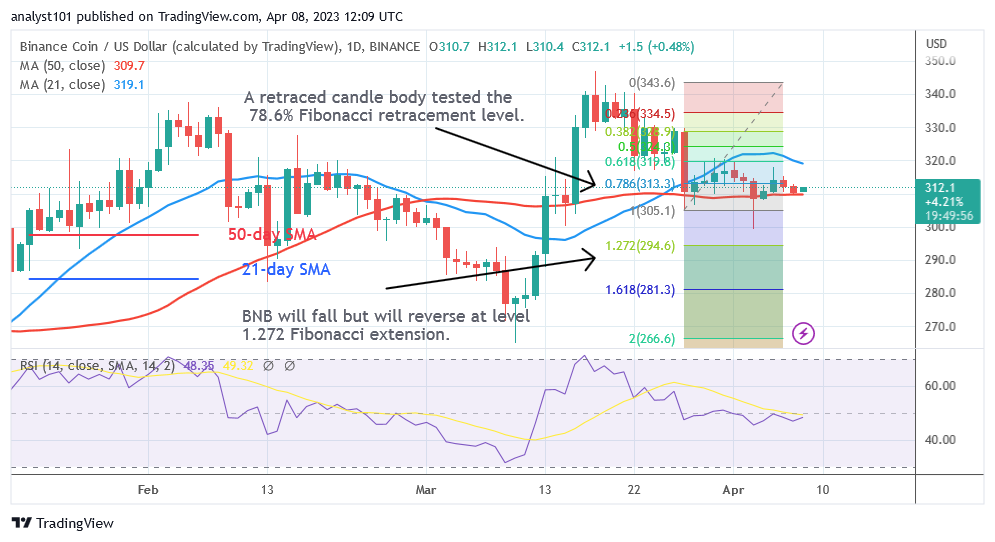
Binance Coin (BNB) price is falling but is pinned between the moving average lines but risks a drop to a low of $294. At the time of writing, the altcoin is worth $311.90. The cryptocurrency has been pinned between the moving average lines for the last four days. A probable decrease and reversal are predicted by the price indication. BNB had an upward corrective during the March 27 decline, and a candle body tested the 78.6% Fibonacci retracement level. According to the retracement, BNB will decline but will turn around at level 1.272 of the Fibonacci extension, or $294.60. If Binance Coin passes over the 21-day SMA, the price will climb and retrace its steps toward its prior high of $340.
Binance Coin (BNB) Indicator Analysis
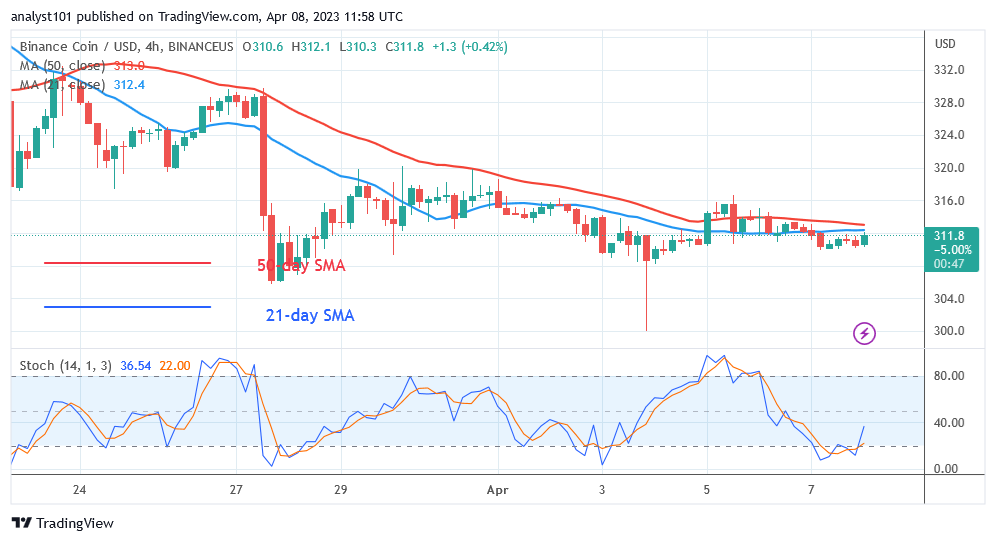
During period 14, BNB is at level 48 on the Relative Strength Index. The cryptocurrency asset could decline as it is in a bearish trend zone. The fact that BNB is currently trapped between the moving averages suggests that it may move inside a range. Above the daily stochastic’s level 25, it has a bullish momentum.
Technical indicators:
Major Resistance Levels – $440, $460, $480
Major Support Levels – $240, $220, $200
What Is the Next Direction for Binance Coin (BNB)?
Binance Coin is currently trading in a confined range between the moving average lines but risks a drop to a low of $294. The price indication foresees a possible decline and reversal. BNB is still confined between the moving average lines in the interim.
You can purchase crypto coins here. Buy LBLOCK
Note: Cryptosignals.org is not a financial advisor. Do your research before investing your funds in any financial asset or presented product or event. We are not responsible for your
__________________________________________________________________________