Tamadoge (TAMA/USD) Gathers Momentum for a Potential Rebound from $0.006
Estimated Reading Time: 3 minutes
Don’t invest unless you’re prepared to lose all the money you invest. This is a high-risk investment and you are unlikely to be protected if something goes wrong. Take 2 minutes to learn more

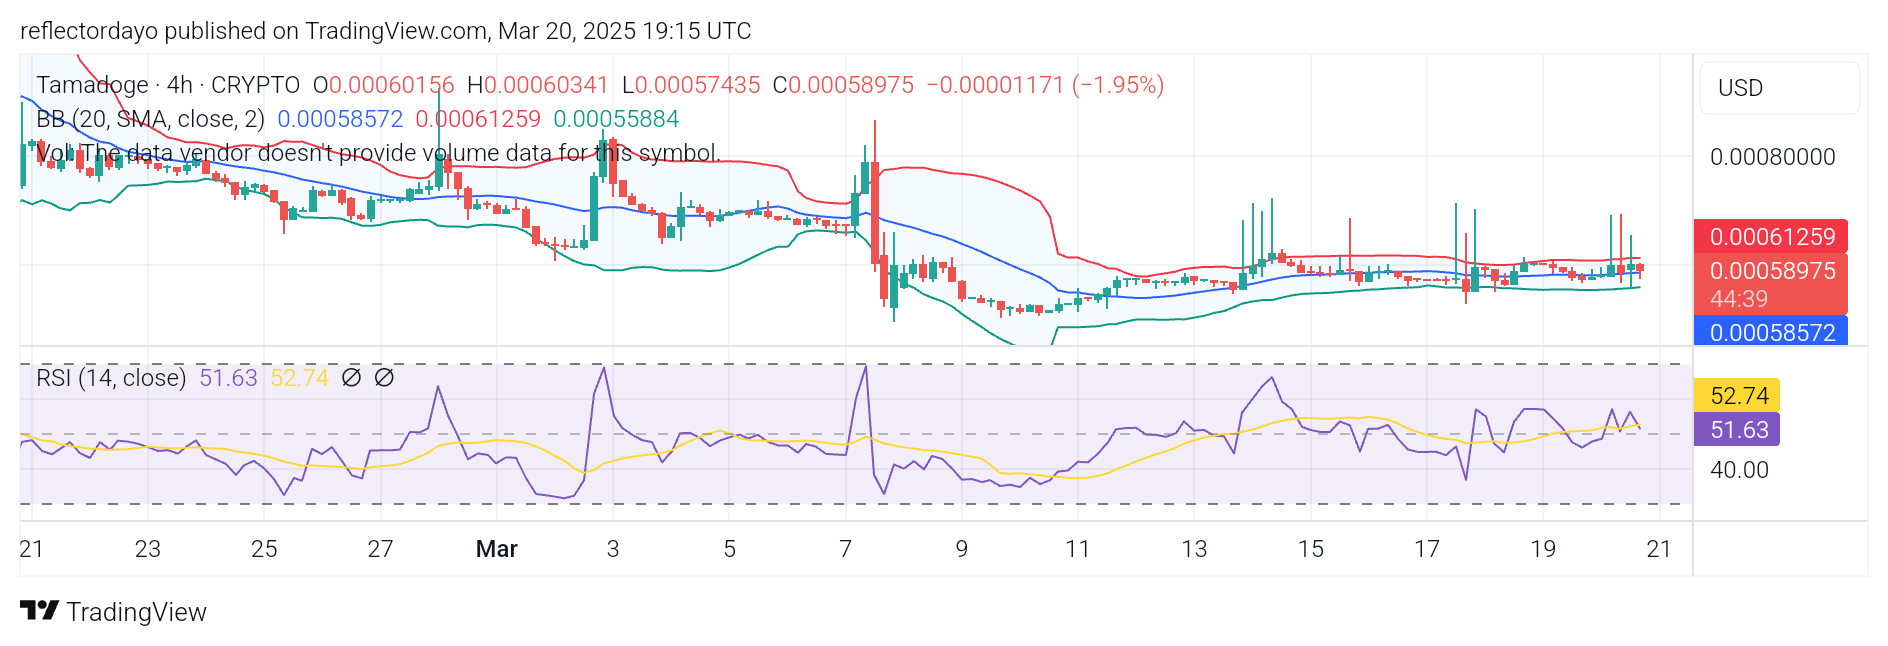
While the $0.005 price level remains under bullish control, buyers are now extending their influence toward the $0.006 level. As the Tamadoge price action consolidates around this range, occasional upward spikes have been testing resistance at $0.007.
The implications of this pattern suggest that, as consolidation continues, these upward price movements could indicate that bulls are gradually building momentum for a potential breakout above the $0.007 resistance level.
Key Levels:
- Resistance: $0.0010, $0.0011, $0.0012
- Support: $0.0005, $0.00045, $0.00040
TAMA/USD Technical Analysis: A Closer Look at Market Indicators
The Tamadoge market has made significant progress despite ongoing bearish pressure. Initially, support was holding at $0.005, but bulls have since pushed the price higher, reaching around the $0.006 level. With the crypto signal stabilizing at this point, there have been repeated tests of the $0.007 resistance level, suggesting that a bullish breakout may be forming.
The recent resistance tests indicate that bulls may be quietly absorbing selling pressure, while traders could also be accumulating the asset in anticipation of a breakout. If this trend continues, the market may soon gain enough momentum to break above the $0.007 resistance level.
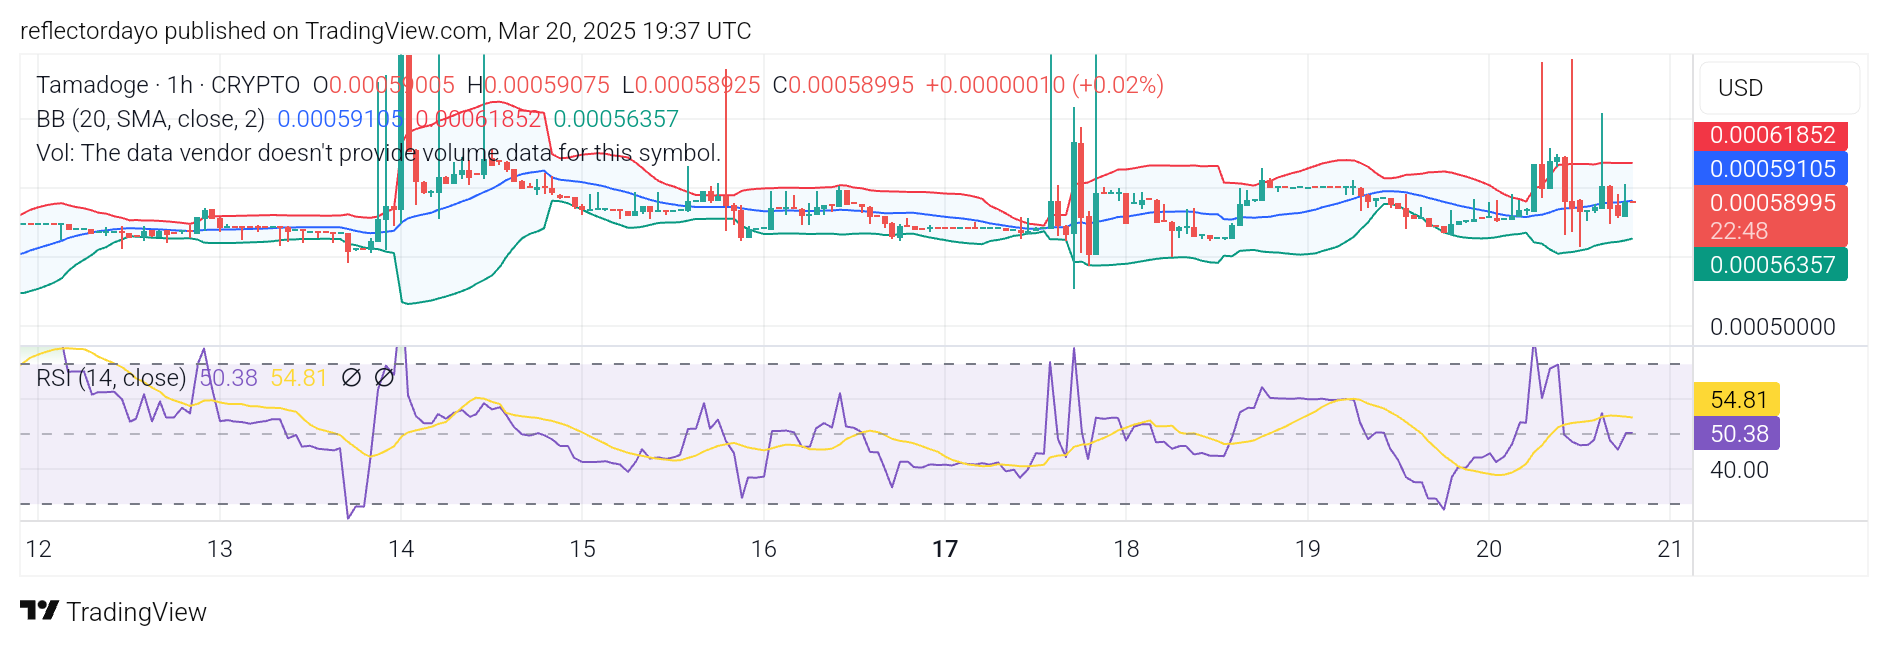
Tamadoge Short-Term Outlook: 1-Hour Chart Analysis
The price is currently holding at the $0.006 level, aligning with the 20-day moving average. Additionally, the Relative Strength Index (RSI) is positioned near its midpoint, indicating a balance between bullish and bearish momentum.
This convergence at a higher level compared to the previous $0.005 support highlights the bulls’ progress in the market. With price consolidation at this level and occasional upward spikes, a potential breakout above the $0.007 resistance may be developing.
Buy TAMAUSD!
Fill your weekend by playing five exhilarating play-to-earn arcade games! 🕹️💰
Battle your way to the top of the weekly leaderboards and load up on $TAMA rewards!
Download on mobile now 👇
📱 Android: https://t.co/D4TjX7gTFl
📱 iOS: https://t.co/0fjJapf5oA pic.twitter.com/6MCruiKcet— TAMADOGE (@Tamadogecoin) September 13, 2024