Ethereum (ETH/USD) Trade Drops, Holding Between $2,500 and $2,000
Estimated Reading Time: 3 minutes
Don’t invest unless you’re prepared to lose all the money you invest. This is a high-risk investment and you are unlikely to be protected if something goes wrong. Take 2 minutes to learn more
Ethereum Price Prediction – January 24
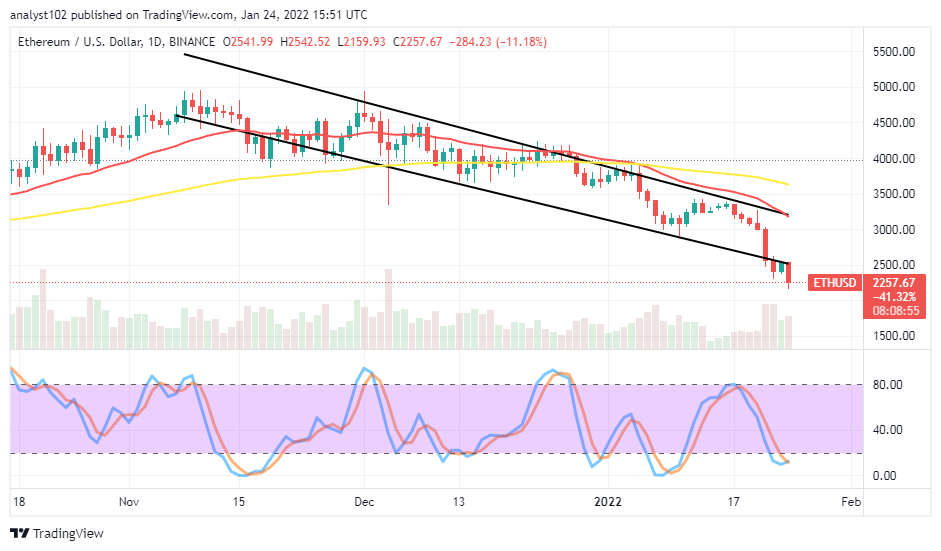
The current bearish-moving pace is heightening as the ETH/USD trade drops, holding between $2,500 and $2,000. The market’s percentage rate of trading is at 11.18 negatives. Presently, price features between the higher value line of $2,542 and a lower point of about $2,159 as of writing.
ETH/USD Market
Key Levels:
Resistance levels: $2,500, $2,750, $3,000
Support levels: $2,000, $1,750, $1,500
.
ETH/USD – Daily Chart
The ETH/USD daily chart shows the crypto-economic trade drops, holding between $2,500 and $2,000. A set of bearish candlesticks has formed underneath the former value line to indicate that the market has entered another spot of lowering. The 14-day SMA indicator is underneath the 500-day SMA indicator. The Stochastic Oscillators have moved down into the oversold region. That signifies that the crypto market tends to slow down for a while.
Will the ETH/USD price lose more to the downside as the crypto trade drops, holding between $2,500 and $2,000?
It may not be a timely gathering of upward momentums by the ETH/USD market buyers to push past the $2,500 resistance sustainably as the crypto-economic trade drops, holding in the value line and the $2,000 afterward. If there is a chance of getting decent buying entry in the current downward trend, the price will have to find support at a level around or a bit above the latterly mentioned value line. Joining a long-moving motion may at a higher spot tend to expose to the bull’s trap in no time.
On the downside of the technical analysis, the ETH/USD market bear has to get repositioned a bit above the $2,500 resistance level to get a decent sell signal. The pressure to the upside projecting toward the presumed value-line may be coming in a slow-and-steady moving manner. If today’s bearish candlestick ends with a long shadow bottom, the value-line mentioned will rebound in no time in the subsequent operations.
ETH/BTC Price Analysis
In comparison, Ethereum has significantly resulted in downing as placed with Bitcoin in trending capacity. The cryptocurrency pair trade drops, holding a bit far below the trend lines of the SMAs. The 50-day SMA indicator is above the 14-day SMA indicator. The Stochastic Oscillators are in the oversold region with their lies closed within. It appears the flagship countering crypto may relax in its efforts to exert more depressions on the base crypto in the near time.
Note: Cryptosignals.org is not a financial advisor. Do your research before investing your funds in any financial asset or presented product or event. We are not responsible for your investing results.
You can purchase crypto coins here. Buy Tokens