Chainlink (LINK/USDT) Consolidates Near Key Demand as Momentum Tries to Flip Bullish
Estimated Reading Time: 3 minutes
Don’t invest unless you’re prepared to lose all the money you invest. This is a high-risk investment and you are unlikely to be protected if something goes wrong. Take 2 minutes to learn more

The market for ChainLink against Tether has gone down by 1.62% in the last 24 hours, towards $13.67. Now, the air altogether in the last month has plummeted 4.5%, an action that can be attributed to rejection near a recent resistance level, weak Grayscale ETF inflows, and Altcoin funding pressure as Bitcoin dominance extends to 58.6%.
Meanwhile, on the daily chart, indicators are suggesting a neutral/weak trend with a bearish bias as indecision lingers in the market.
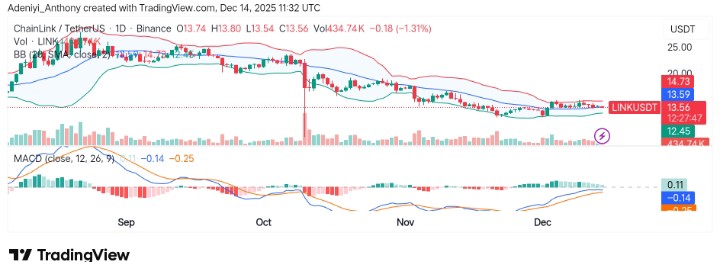
Currently, ChainLink trades at $13.56 with over 434,000 traded volumes on the daily timeframe.
Technical Indicators
Major Resistance Levels: $14.70, $15.50, and $16.80
Major Support Levels: $13.38, $12.80, and $12.00
Technical Analysis
Technically, ChainLink against Tether on the daily timeframe is halfway to the south, trending downward and slowly pressing toward the dynamic mid-Bollinger band. As it stands, the MACD appears to be turning bearish, suggesting that bullish momentum is waning.
To this end, the pair is still cautiously bullish if the price holds above demand; otherwise, a fall below $13.40 may signal the start of a fresh move to the south, while a flip above $14.70 would render such a move invalid.
ChainLink’s Technical Update
ChainLink has continued to consolidate within a close range on the weekly chart. The token, after the formation of several highs and lows, has extended its operation below the $17.00 resistance level. Meanwhile, on the smaller timeframe, the indication of a potential low looms as the price tends towards $12.35 support. To this end, if ChainLink fails to operate above $14.36, operation below the current position, especially $10, may be seen.
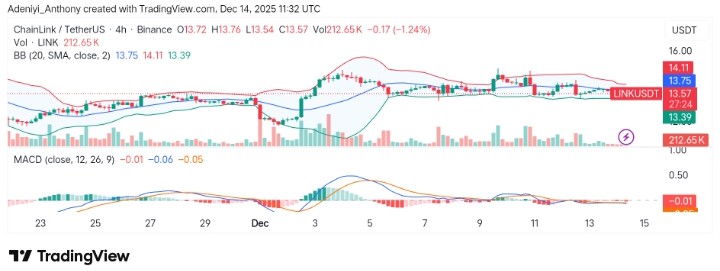
LINK/USDT Analysis: Consolidating After Sharp Rebound
On the 4-hour time frame, LINK/USDT appears to be exhibiting the same structure on the daily chart. However, the price seems to be operating extensively under the 20-period moving averages, suggesting the bears want to turn the market after what appears to be a short-term recovery.
Meanwhile, the momentum oscillator, on the other hand, is near zero, bringing to the limelight the indecisive nature of participants as the market awaits a breakout. To this end, a slight move above $13.75 in the short term may change the narrative, but for now, a move below $13.38 signals a further dip.
You can purchase crypto coins here. Buy Crypto