Bitcoin Price Prediction: BTC/USDT Hits a New All-Time High
Estimated Reading Time: 3 minutes
Don’t invest unless you’re prepared to lose all the money you invest. This is a high-risk investment and you are unlikely to be protected if something goes wrong. Take 2 minutes to learn more

Bitcoin Price Prediction for November 6
The price of Bitcoin has recently seen a massive increase, unlike anything observed in recent times, pushing the token to trade above the $74,000 mark. As a result, trading indicators are suggesting that further price increases may be on the horizon.
BTC/USDT Long-Term Trend: Bullish (Daily Chart)
Key Price Levels:
Resistance: $75,000, $80,000, $85,000
Support: $70,000, $65,000, $60,000
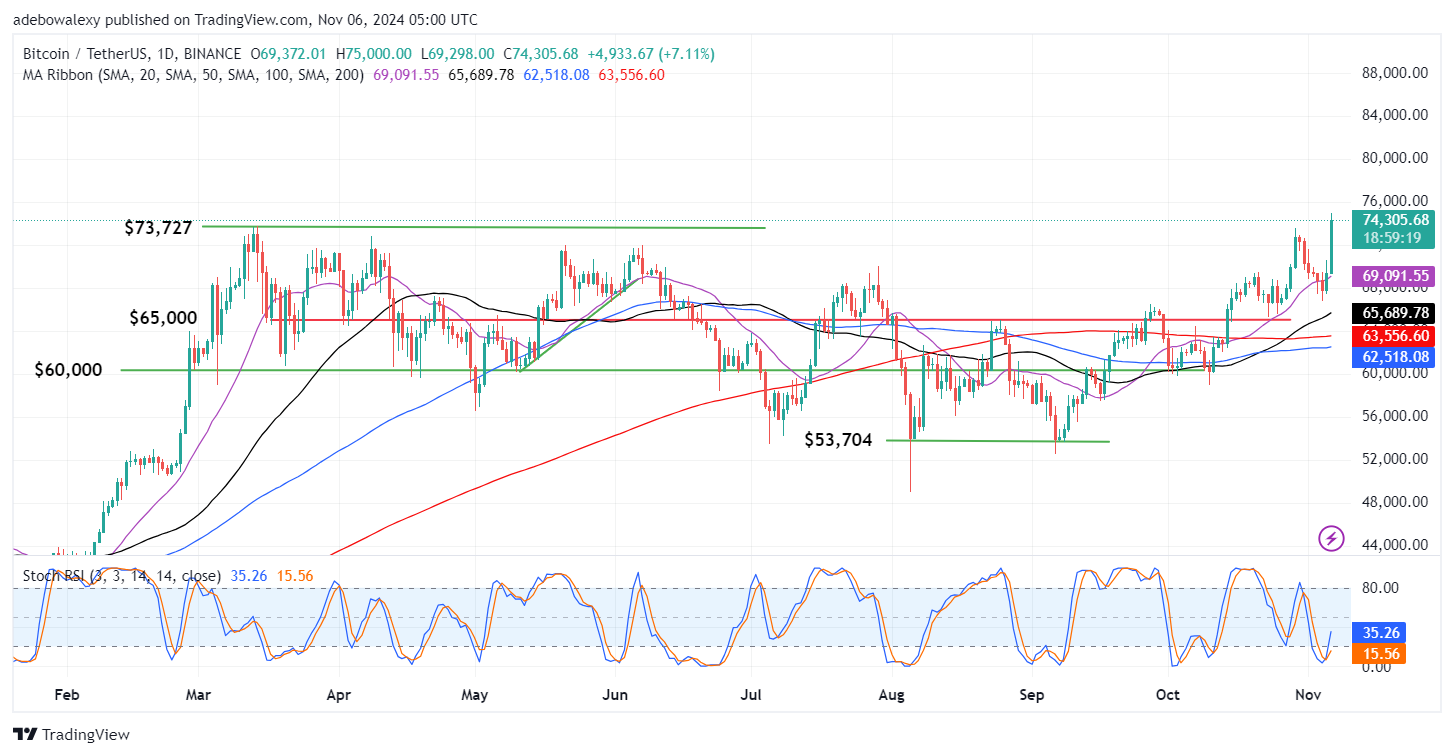
The latest price candle on the daily chart is quite large, appearing to be the biggest in recent times. This candle has lifted the token to trade at a significant distance above the Moving Average lines. Additionally, the sharp price movement has resulted in an upside crossover on the Stochastic Relative Strength Index (Stochastic RSI) indicator. A closer look reveals that the Stochastic RSI lines are moving in line with price changes, indicating that the momentum is consistent and not overly exaggerated.
Bitcoin Price Prediction: BTC/USDT Eyes the $76,000 Threshold
Price activity on the daily Bitcoin chart suggests that additional gains may be possible. The latest price candle stands out above all the Moving Average lines, and its upper shadow indicates that prices briefly tested the resistance at the $75,000 level. However, there has been a minor price pullback, as revealed by the upper shadow on the latest price candle.
Moreover, the behavior of the Stochastic RSI suggests that upward forces are aligning with price movements. The Stochastic RSI has shown a bullish crossover in the oversold region, and its lines are trending upward. Notably, the indicator lines are not moving in an exaggerated fashion, suggesting that bullish momentum in this market is likely solid.
Bitcoin Price Prediction: BTC/USDT Sees a Minor Pullback (4-Hour Chart)
Switching to the 4-hour chart, BTC/USDT continues to behave as expected. The current session has shown a modest downward retracement, yet the market remains at a significant distance above the Moving Average lines. Additionally, the Stochastic RSI lines are still projected upward in the overbought region.
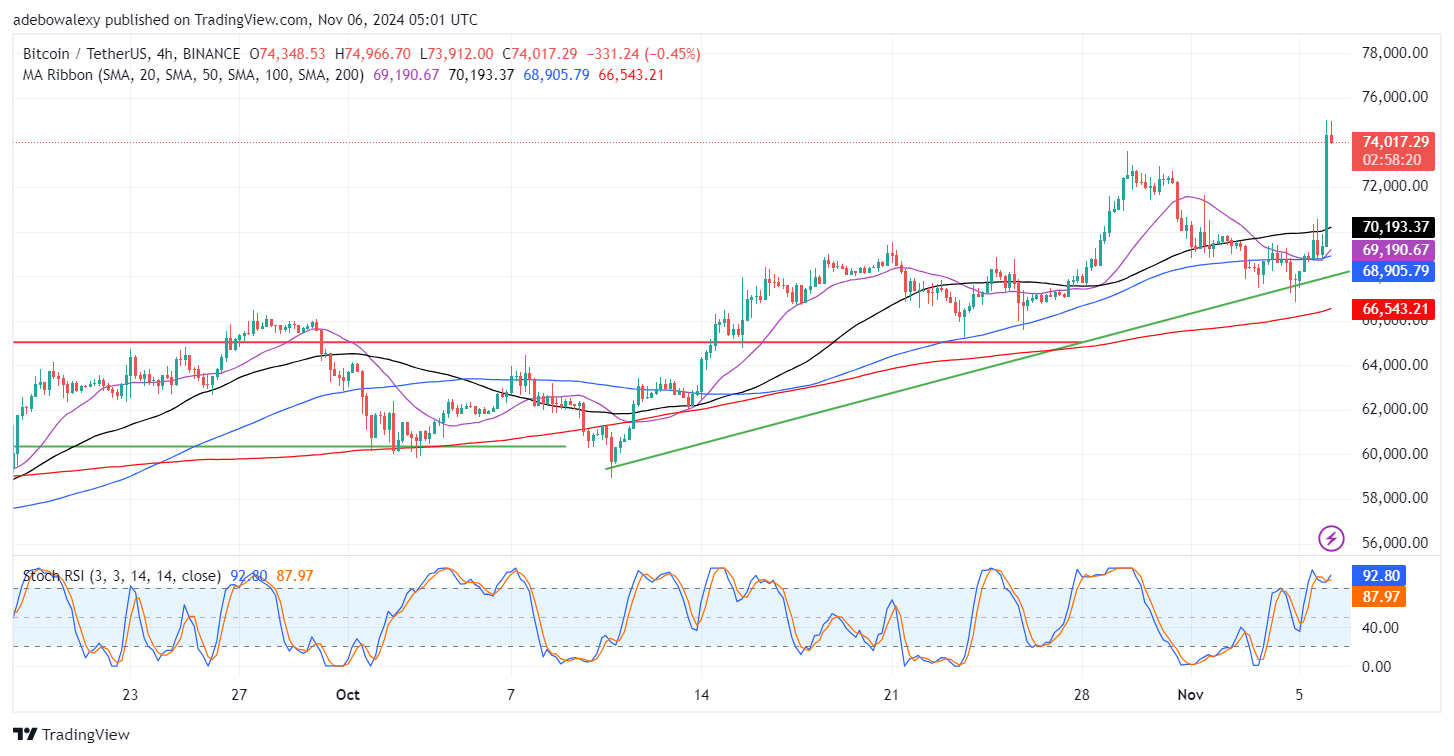
This indicates that the observed retracement may not be overly significant at this point. After all, the price of the token remains comfortably above the Moving Average lines. Furthermore, the Stochastic RSI lines retain their upward trajectory despite the minor pullback. Consequently, traders may remain optimistic about short-term gains, targeting the $76,000 price level.