Litecoin Price Prediction: LTC/USDT Market May Now Hit the $75 Mark
Estimated Reading Time: 3 minutes
Don’t invest unless you’re prepared to lose all the money you invest. This is a high-risk investment and you are unlikely to be protected if something goes wrong. Take 2 minutes to learn more
Litecoin Price Prediction for October 29
The Litecoin market has been able to sustain itself above the $66.50 threshold level. Additionally, the token’s price action seems favored on the fundamental front, now that Bitcoin has resurfaced above the $70,000 price level.
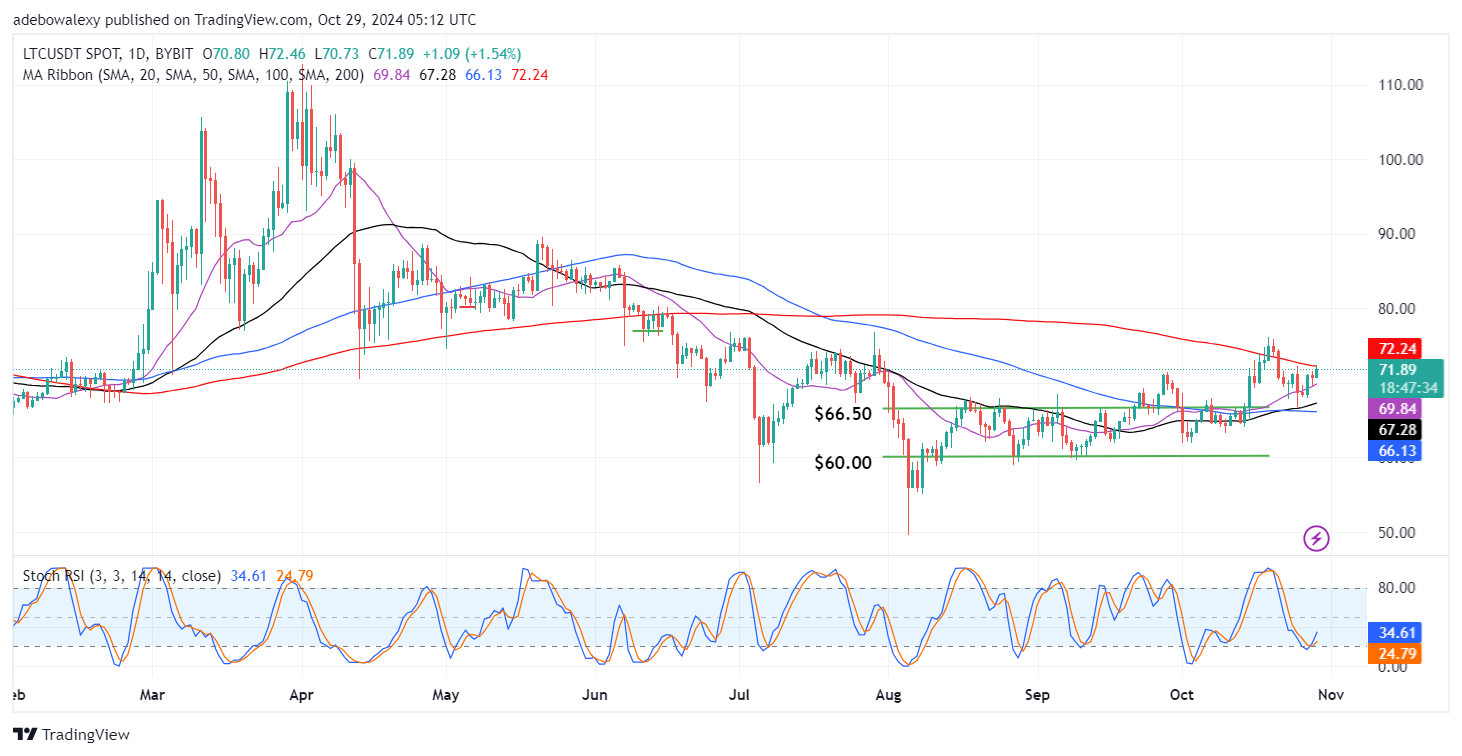
LTC/USDT Long-term Trend: Bullish (Daily Chart)
Key Price Levels:
Resistance: $75.00, $80.00, $85.00
Support: $66.50, $63.00, $60.00
The last price candle on the chart can be seen appearing green above the 20-, 50-, and 100-day Moving Average (MA) lines. The only MA line above the price action on the daily chart is the 200-day MA curve. Additionally, these indicator lines can be seen converging toward the 20-day MA line. At the same time, the Stochastic Relative Strength Index (RSI) lines are rising upward following an upside crossover just above the 20-mark of the indicator.
Litecoin Price Prediction: LTC/USDT Sees Minimal Rejection But May Easily Shake It Off
Price activity in the Litecoin daily market suggests that traders may be motivated to buy. This is because, on both a technical and fundamental basis, the market is tipped to progress higher. Litecoin now trades above most of the MA lines and, as such, suggests that prices may forge ahead.
The convergence of even the slowest of the MA lines also hints that upside forces may be gaining more dominance. Coupled with the display of the Stochastic RSI indicator—which confirms the activity of upside forces—more traders may want to go with the trend early enough to maximize gains.
Litecoin Price Prediction: LTC/USDT Still Appears Challenged (4-Hour Chart)
In the Litecoin 4-hour market, price action has crossed above all MA lines. The corresponding price candle to the previous session also leaves a strong impression that buyers are in control of price movements. The 20- and 50-day MA lines are now converging for a crossover below price action. Meanwhile, the latest price candle here on the chart suggests that there is minor rejection in the market. Additionally, the Stochastic RSI lines can be seen to have risen above the 80 mark of the indicator.
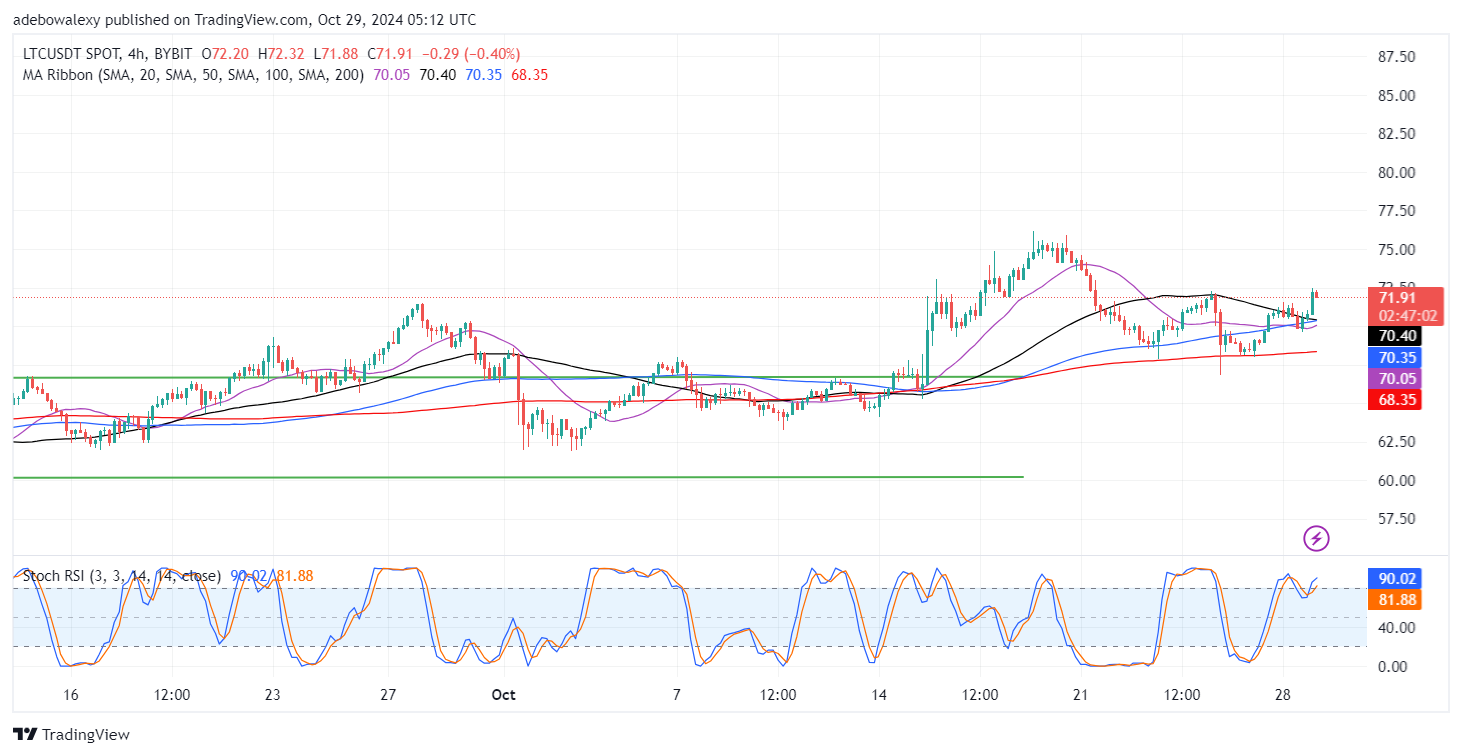
Despite the rejection seen in the ongoing session, this market seems to stay primed for more upside moves. The convergence of the 20- and 50-day MA curves hints that the current rejection may not result in anything significant. Also, the Stochastic RSI lines are now in the overbought region, and as such, the deflection of the leading line of the indicator may not result in a bearish crossover. Therefore, traders may want to keep their target at the $75 price level for short-term gains.