Polkadot (DOT/USDT) Seeks to Break Above $5.796 Critical Level
Estimated Reading Time: 3 minutes
Don’t invest unless you’re prepared to lose all the money you invest. This is a high-risk investment and you are unlikely to be protected if something goes wrong. Take 2 minutes to learn more
Polkadot Long-term Analysis: Bearish
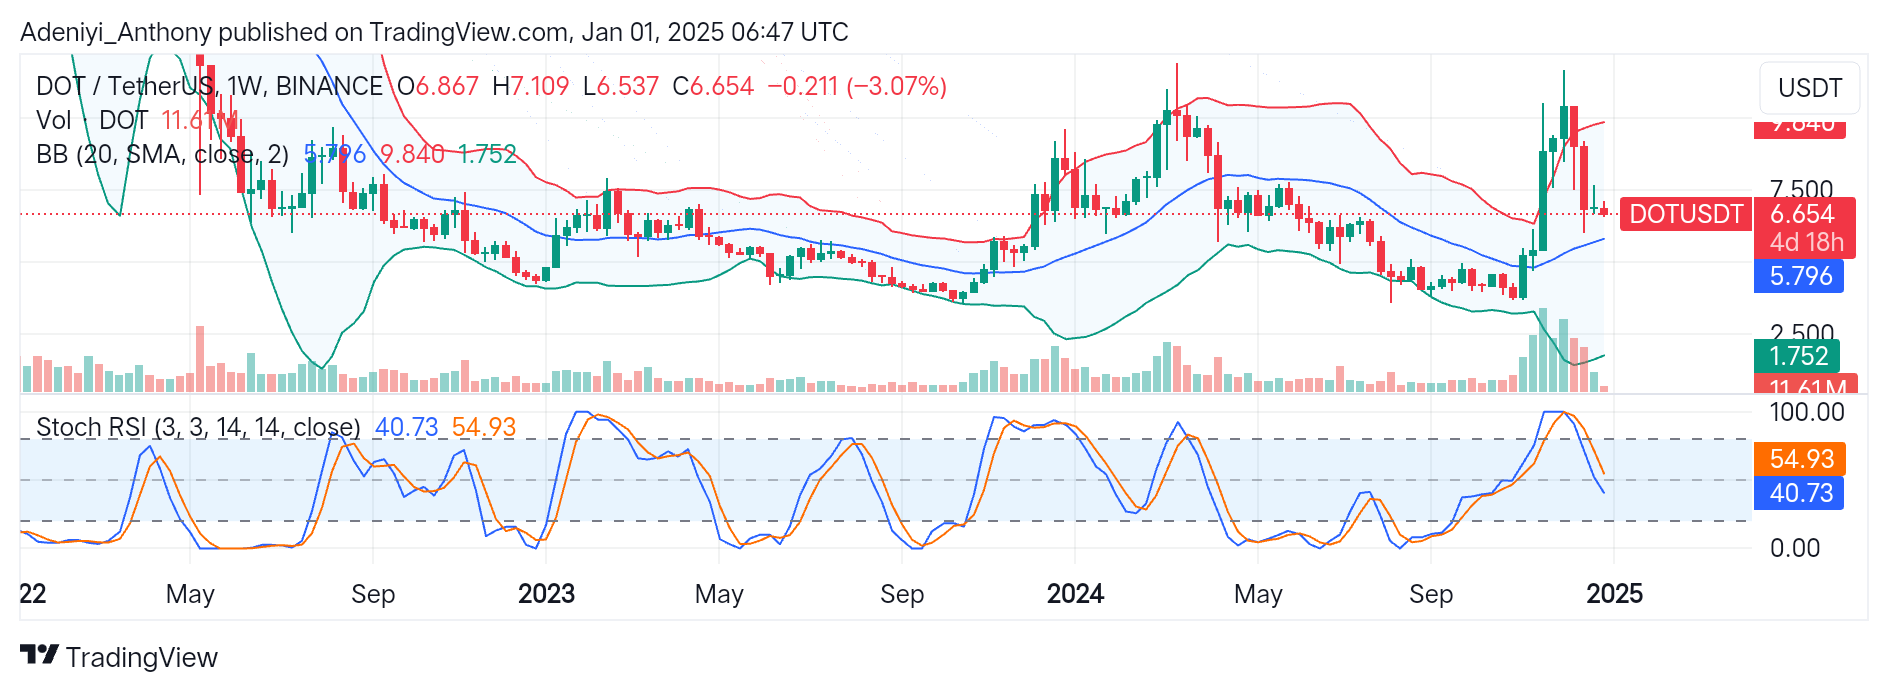
Polkadot against the Tether reflects a market with cautious sentiment amid overall market volatility. The chart below reflects a market with bearish momentum, as previous price movement shows price retracing from a high around $7.100 towards the dynamic mid-band at $5.796.
However, recent price action suggests a further downtrend, as the current trades are 3.07% below the previous trading session. To this end, traders should closely watch the immediate resistance and support levels for a reversal and continued downtrend.
Currently, Polkadot is trading at $6.654, with 11.61 million weekly traded volumes.
Technical Indicators
Major Resistance Levels: $7.109, $7.840, and $9.840
Major Support Levels: $5.786, $5.000, and $1.752
Polkadot Technical Analysis
The weekly analysis of Polkadot shows the coin is at a critical juncture with continued bearishness as the price deepens towards the mid-Bollinger band. However, as the overall trend remains bearish, a move below the dynamic 20-period moving average would indicate further downside movement toward the $5.000 psychological level. Conversely, sustained momentum above the mid-band would signal an impending bullish breakout.
Additionally, the Stochastic RSI suggests a weakened momentum as both lines of the indicator point downward with the lead line reading below the 50-mark level. However, as the line continues in this direction, the $5.786 would be subjected to a serious test. To this end, a bullish crossover of the lines would indicate a reversal.
DOT/USDT Analysis: A Reversal or Continued Downtrend?
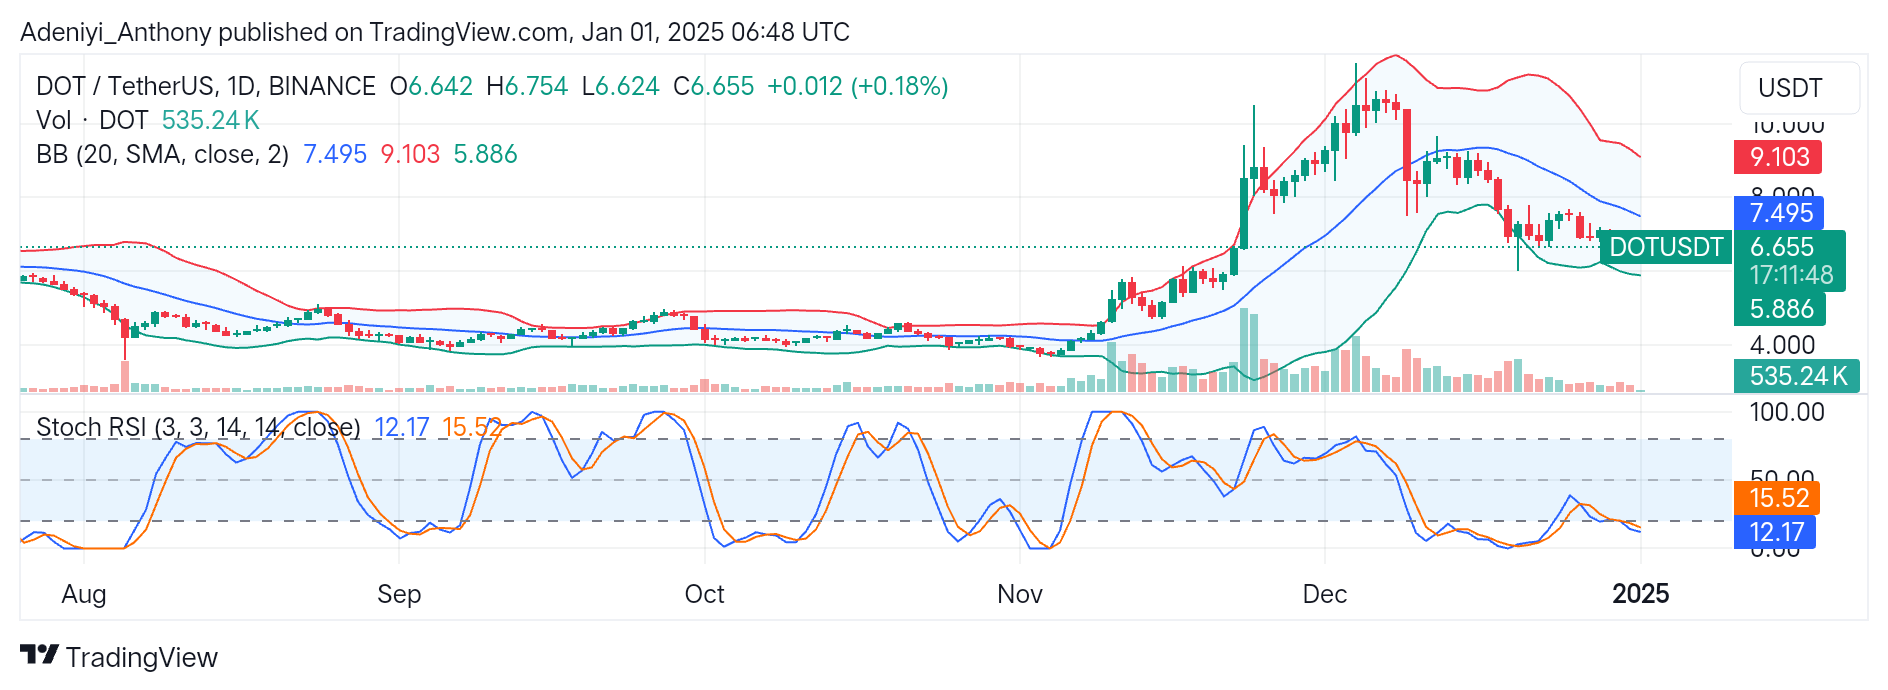
The analysis of DOT/USDT on a daily timeframe shows that the price is currently operating close to the lower band with an impending move towards the 20-day moving average. The Bollinger bands show a narrowing range, an indication of reduced volatility, and a potential breakout in either direction.
Additionally, the stochastic RSI indicates an oversold condition for the pair, as both lines read values below the 30-mark level. This condition, though, suggests strong selling pressure but indicates a potential reversal in the near term.
To this end, with a strong trading volume, a continued downtrend is expected if the price breaks below $5.886. Conversely, the oversold condition of the Stochastic oscillator hints at a bullish reversal if the price hits above the $7.495 level.
You can purchase crypto coins here. Buy LBlock