Dogecoin (DOGE) Price Prediction: DOGE Price Action Seems to Have Found a Higher Baseline
Estimated Reading Time: 3 minutes
Don’t invest unless you’re prepared to lose all the money you invest. This is a high-risk investment and you are unlikely to be protected if something goes wrong. Take 2 minutes to learn more

Dogecoin (DOGE) Price Prediction: May 27
In recent sessions, the Dogecoin market has consistently found higher support levels. This trend started when the token’s price action tested the support level at the $0.1200 mark. Since then, the market has been trending upwards, and each time it regresses, it rebounds off a higher price level. Even in the ongoing session, it seems like another higher baseline has been located.
DOGE/USDT Long-term Trend: Bullish (Daily Chart)
Resistance Levels: $0.1700, $0.1900, and $0.2100
Support Levels: $0.1600, $0.1400, and $0.1200
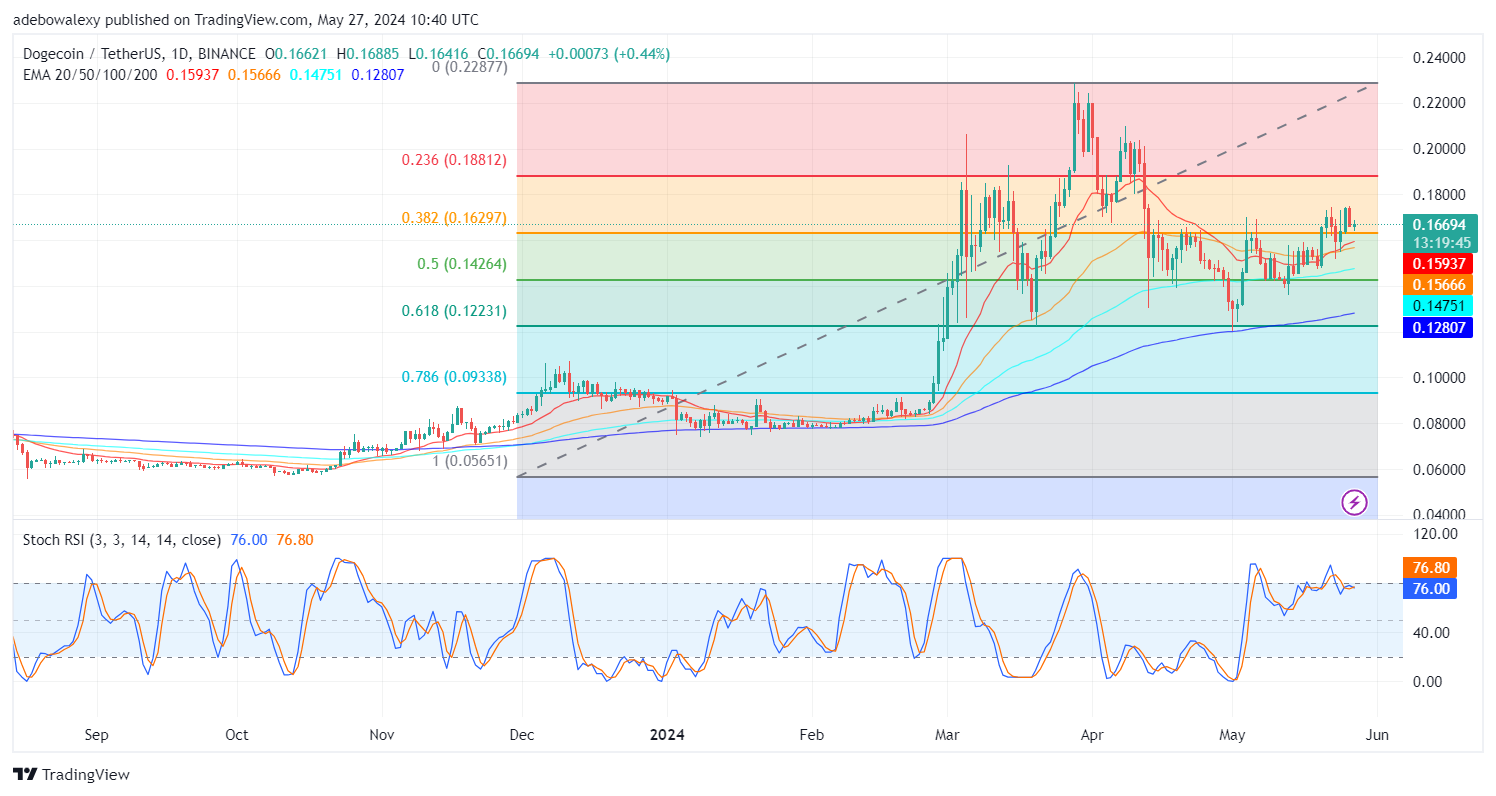
The last price candle in this market appeared just after the price action reached the 38.20 Fibonacci Retracement level. Additionally, the mentioned price candle has appeared above all the Exponential Moving Average (EMA) curves. Meanwhile, the Stochastic Relative Strength Index (SRSI) indicator lines have just delivered what ought to be a downward crossover. However, the orientation of the ensuing lines seems unclear, as they are pointed sideways above the 70 mark.
Dogecoin Price Prediction: Will the Upside Rebound Be Successful?
The movement of price action on the DOGE daily market appears to have been more predictable. Recently, the market has been progressively making higher lows. Now, upside forces are trying to make a stand after testing the 38.20 Fibonacci Retracement level. Also, price action has staged resistance above all the EMA lines.
This suggests that the upside potential is on the increase. However, the behavior of the SRSI indicator lines doesn’t quite support this view; rather, it appears that market forces are forcing their movement. This has caused the indicator lines to remain sideways following the delivered crossover. Nevertheless, one can say that the market has a fair chance of staging a successful upside rebound at this point.
DOGE/USDT Medium-term Trend: Dogecoin Upside Hopes Look Bright (4H Chart)
The staged resistance in the DOGE market has persisted in the 4-hour market time frame. The only difference is that the last price candle is below the 20-day EMA curve. Price action is now attempting to rise above the mentioned EMA lines. The SRSI indicator lines can be seen delivering an upside crossover deep in the oversold region.
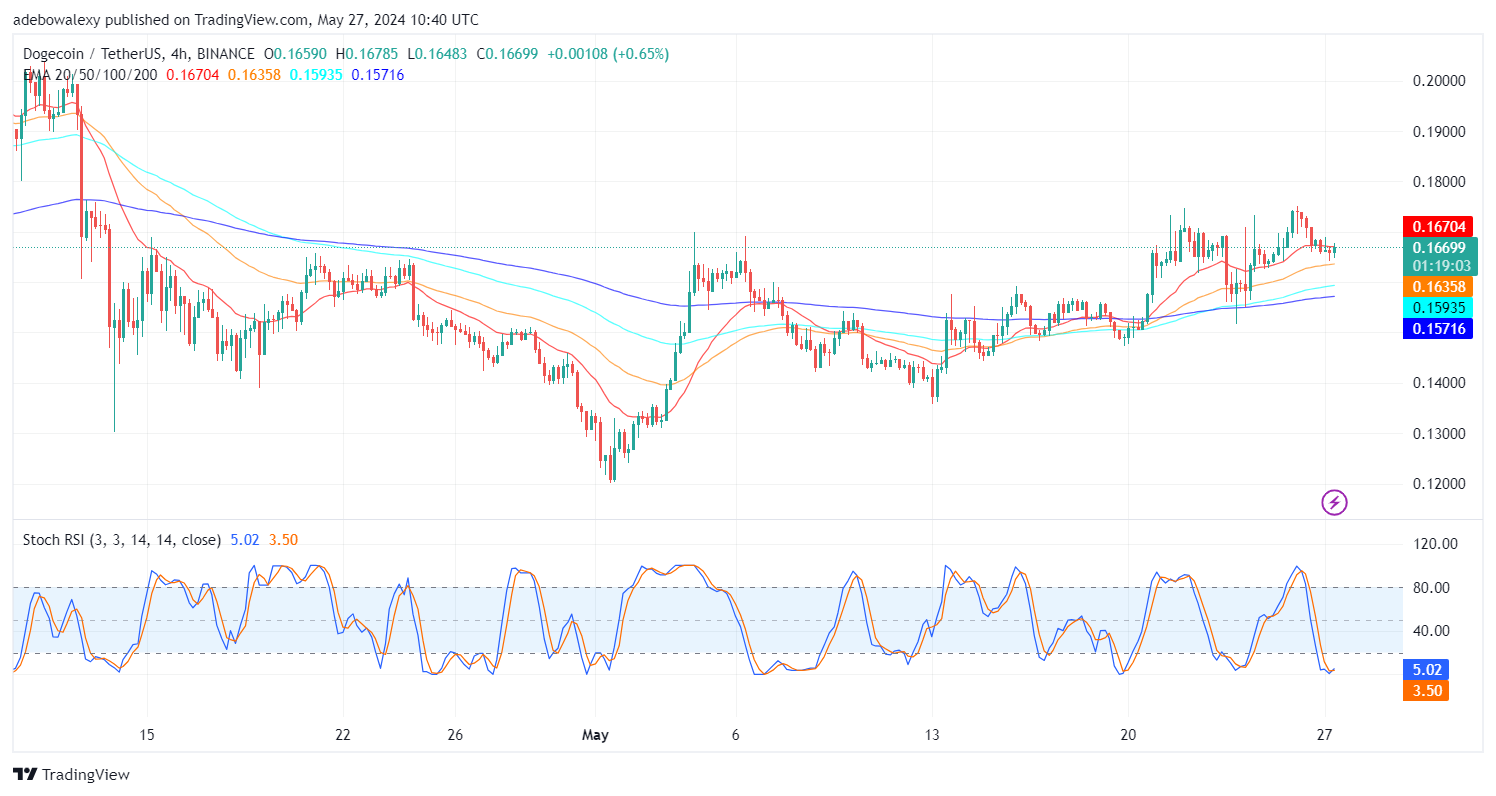
This shows that upside forces will likely gain more bullishness. This will initially cause the market to surpass the 20-day EMA line. Subsequently, the upside move will be further strengthened as more traders may see this as a bullish signal, prompting them to join the trend. We may soon see the market hit the $0.1800 mark.