SPONGE/USD ($SPONGE) Steers Toward $0.0001145 with Resilient Bullish Sentiment
Estimated Reading Time: 3 minutes
Don’t invest unless you’re prepared to lose all the money you invest. This is a high-risk investment and you are unlikely to be protected if something goes wrong. Take 2 minutes to learn more

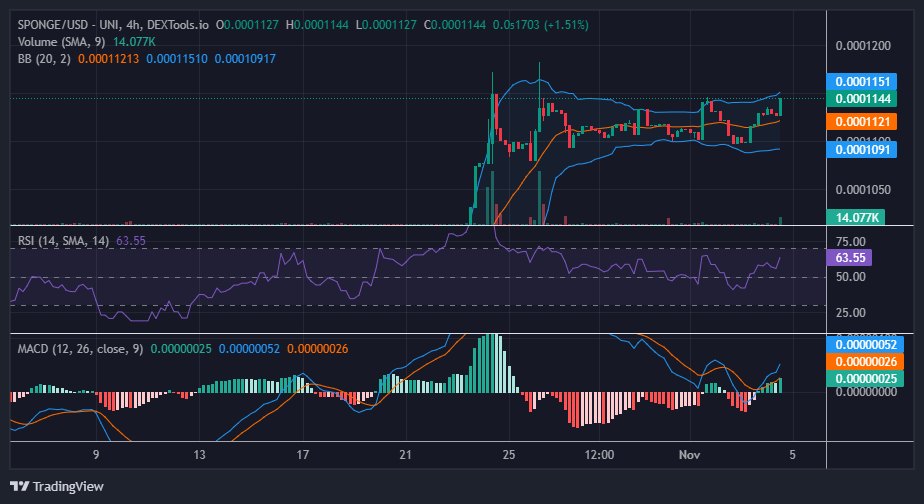
In the present SPONGE/USD market landscape, a well-established support level at $0.00011 emphasizes the prevailing dominance of bullish sentiment. On November 1st, amidst a pronounced bearish phase, bullish traders momentarily gathered just below the $0.0001099 price threshold, effectively warding off bearish pressures in this vicinity. This marked the turning point where the market charted a course towards the $0.0001145 price objective.
Key Price Levels
- Resistance: $0.000115, $0.000120, and $0.000125.
- Support: $0.000090, $0.000080, and $0.000085.
Sponge (SPONGE/USD) Price Analysis: Technical Insights
The SPONGE/USD market recently solidified its footing above the 20-day moving average, exerting an influence on the upper boundaries of the Bollinger Bands indicator. Consequently, the indicator exhibits early signs of transitioning into an upward trajectory. With persistent bullish momentum, the market holds the potential to approach the $0.00012 price mark, building upon prior near misses on October 26. Furthermore, the RSI line has surged sharply to 63.55, attesting to the vigor of the ongoing bullish trend.
Short-Term Outlook: 1-Hour Chart
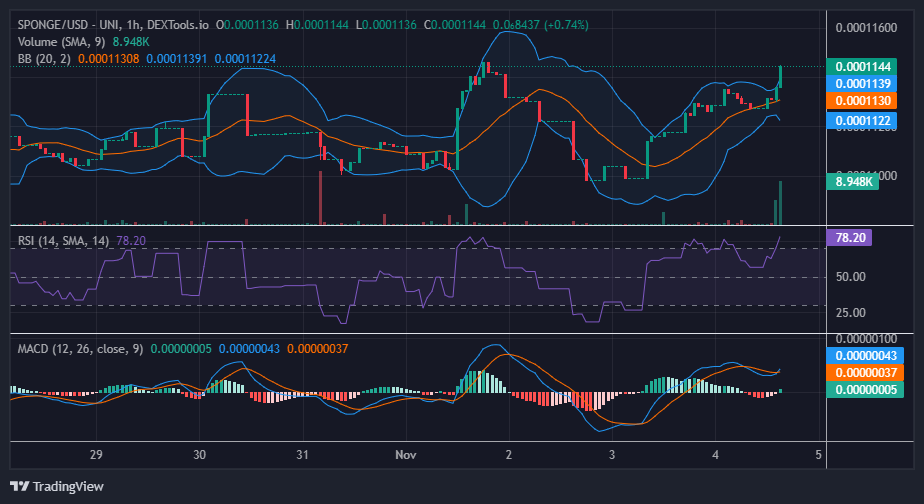
The SPONGE/USD market embarked on an initially vigorous upward journey, marked by restrained trading volume signals during earlier sessions. Recent times, however, have witnessed an influx of bullish traders, propelling prices toward the coveted $0.0001145 target. Prior to achieving this milestone, the Bollinger Bands indicator briefly converged, underscoring the resilience of the bullish market.
The prevailing bullish momentum remains robust, heightening the likelihood of the market surpassing the $0.0001145 price objective, further reinforced by the strength exhibited by the bulls. It’s worth acknowledging the historical pattern, where many traders have historically positioned their sell orders around this level.
Put November 7th on your calendars! At that point, our special $SPONGE airdrop will be given out!
🔥 Exciting news, #SPONGERS! 🔥
🗓Mark your calendars for November 7th! That’s when our exclusive $SPONGE airdrop gets distributed!🚀
Head over to our website to see if you made it on our #SPONGE leaderboard 🙌
Stay tuned for updates! 🚀#Web3 #Crypto pic.twitter.com/ZBDm9eoHMY
— $SPONGE (@spongeoneth) November 3, 2023
Invest in the hottest and best meme coin. Buy Sponge ($SPONGE) today!