Polygon (MATIC/USD) Price Maintains a Mild Trading Recession
Estimated Reading Time: 3 minutes
Don’t invest unless you’re prepared to lose all the money you invest. This is a high-risk investment and you are unlikely to be protected if something goes wrong. Take 2 minutes to learn more
Polygon Price Prediction – April 2
The MATIC/USD market maintains a mild trading recession toward the $1.20 resistance line. The cryptocurrency against US dollars features between the low and high of $1.102 and $1.123. Although the percentage rate is encouraging, the bullish trading momentum has mostly peaked. Therefore, the exertion of longing order will have to suspend for a while.
MATIC/USD Market
Key Levels
Resistance levels: $1.20, $1.30, $1.40
Support levels: $1, $0.90, $0.80
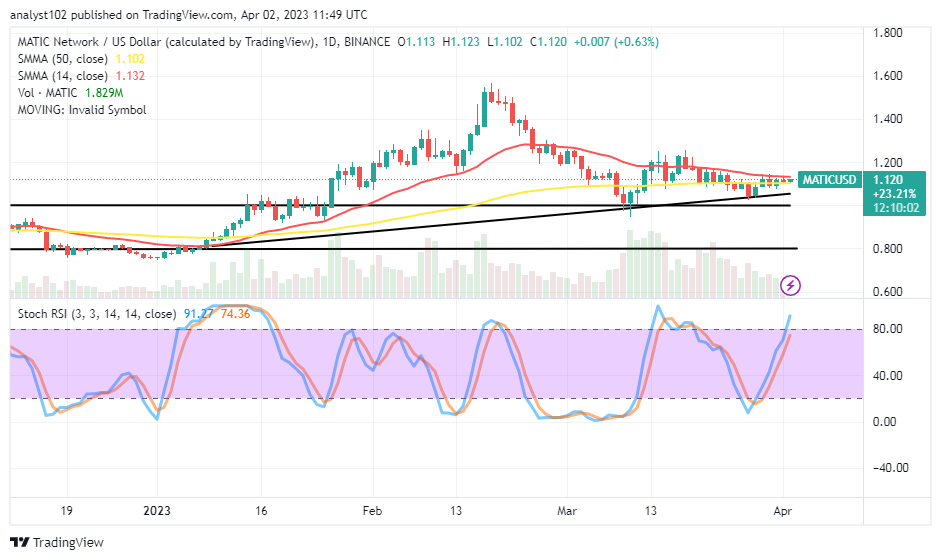
MATIC/USD – Daily Chart
The MATIC/USD daily chart showcases the crypto-economic price maintains a mild trading recession closely beneath the sell signal side of the smaller SMA trend line. The 50-day SMA indicator is at $1.102, underneath the $1.132 value line of the 50-day SMA indicator. The Stochastic Oscillators have penetrated the overbought region, keeping 74.36 and 91.27 levels. That implies buying orders may not uprise further through breaking resistances.
Would the value of the MATIC/USD trade rise in anticipation of a breakout around the $1.20 resistance?
It will be hard for the MATIC/USD market operation to get spiked and sustain it beyond the $1.20 resistance line as it has presently noticed that the crypto-economic price maintains a mild trading recession outlook over time. Bulls must confirm a consolidation-moving mode around the zone as the price deals with the scenario to push higher and make more money. Buying actions be on hold until another round of the Stochastic Oscillator reading observed at lower levels in the spirit of exercising prudence.
On the downside of the technical analysis, the MATIC/USD market sellers may start to reposition their stances closely beneath or around the $1.20 resistance line. A sell limit order could be around the value line. And in the pattern of achieving that, an uprise around the value line needs to turn fake to allow a sell-off session to take place. Bears might not receive credible signals to create a firm shorting entry if that assumption doesn’t come true.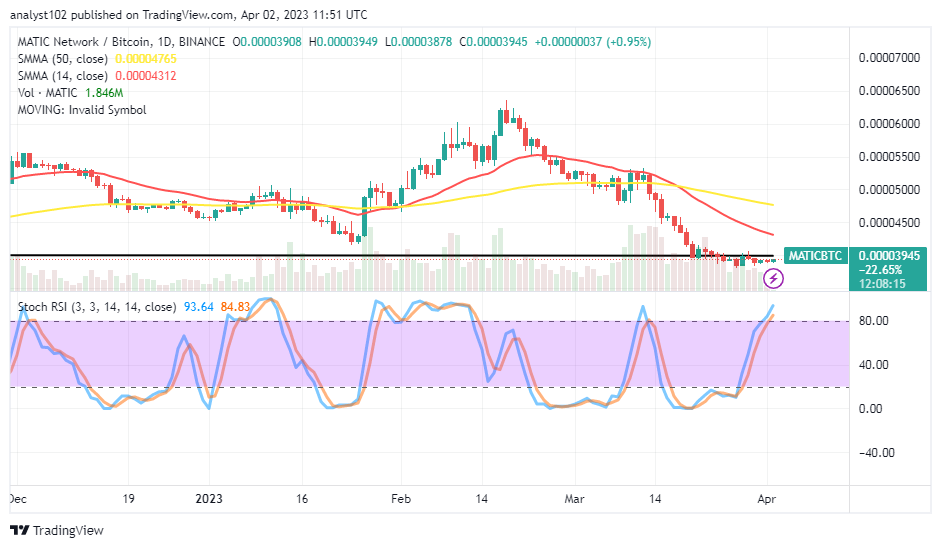
MATIC/BTC Price Analysis
In contrast, it currently showcases on the daily chart that the Polygon maintains a mild trading recession against Bitcoin. Over a couple of days, the pairing crypto market is around the horizontal line underneath the trend lines of the SMAs. The 14-day SMA indicator is beneath the 50-day SMA indicator. The Stochastic Oscillators are in the overbought region, keeping 84.83 and 93.64 levels. From a technical perspective, it suggested that the price would need some time to restore its baseline before bouncing back and maybe experiencing ups sequentially after that.
Note: Cryptosignals.org is not a financial advisor. Do your research before investing your funds in any financial asset or presented product or event. We are not responsible for your investing results.
You can purchase Lucky Block here. Buy LBLOCK