Ripple (XRP) Continues Bullish Run, Unable to Break Recent High
Estimated Reading Time: 2 minutes
Don’t invest unless you’re prepared to lose all the money you invest. This is a high-risk investment and you are unlikely to be protected if something goes wrong. Take 2 minutes to learn more
Ripple (XRP) Long-Term Analysis: Bearish
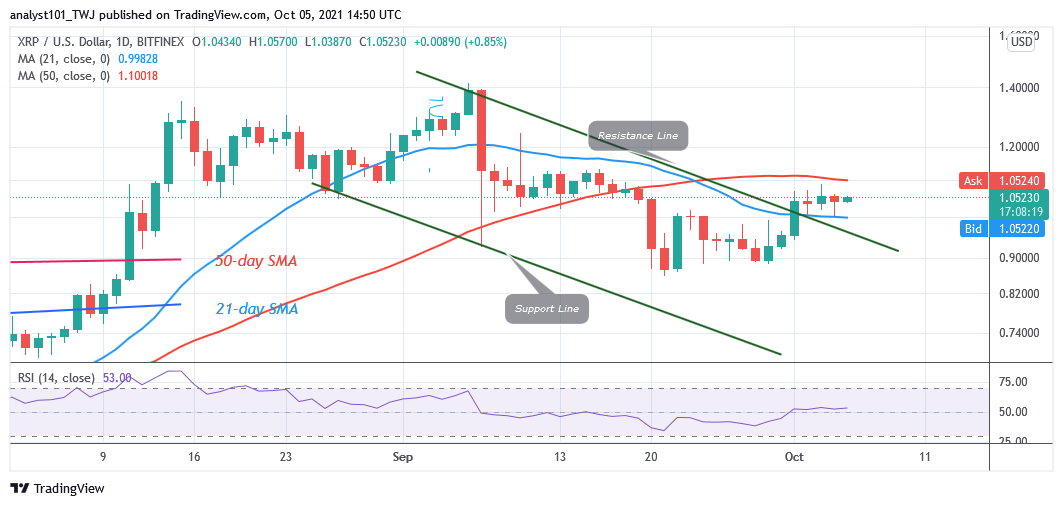
Since October 1, the XRP price has broken above the 21-day SMA but faced resistance at the 50-day SMA. For the past five days, the XRP price fluctuates between the 21-day SMA and the 50-day SMA. In other words, the altcoin is consolidating below the resistance at level $1.08. . Nevertheless, if buyers sustain the bullish momentum above the 50-day SMA, XRP will rally to the high of $1.20. Subsequently, the bullish momentum will extend to the high of $1.40. However, the market will continue to rebound if the bulls fail to break above the 50-day SMA.
Ripple (XRP) Indicator Analysis
Ripple is at level 54 of the Relative Strength Index period 14. It indicates that the altcoin is still in the bullish trend zone and capable of further upward. XRP is above the 70% area of the daily stochastic. The altcoin is in a bullish momentum. The current uptrend has been stalled as the coin is compelled to resume a sideways move. The uptrend will resume when the resistance is breached.
Technical indicators:
Major Resistance Levels – $2.00, $2.50, $3.00
Major Support Levels – $1.50, $1.00, $0.50
What Is the Next Direction for Ripple (XRP)
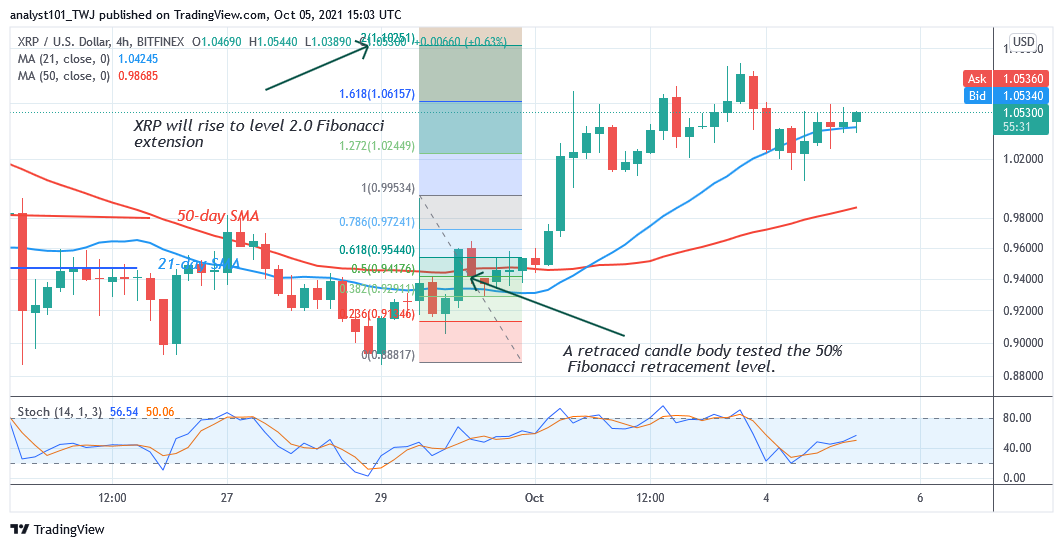
On the 4 – hour chart, Ripple is in an upward move. The bulls broke above the moving averages but could not breach the $1.10 resistance zone. Meanwhile, on September 29 uptrend; a retraced candle body tested the 50% Fibonacci retracement level. The retracement indicates that XRP price will rise to level 2.0 Fibonacci extension or $1.10.
You can purchase crypto coins here. Buy Tokens
Note: Cryptosignals.org is not a financial advisor. Do your research before investing your funds in any financial asset or presented product or event. We are not responsible for your investing results