OFFICIAL TRUMP (TRUMP/USDT) Faces Resistance as Volatility Continues
Estimated Reading Time: 3 minutes
Don’t invest unless you’re prepared to lose all the money you invest. This is a high-risk investment and you are unlikely to be protected if something goes wrong. Take 2 minutes to learn more

Official Trump against Tether has risen by 1.16% in the last 24 hours. As it stands, this surge was primarily driven by strong technical signals, including a breakout above critical resistance levels, which sparked bullish momentum among investors.
Moreover, the market appears to be seeing less pressure from token unlocks, with daily releases now being absorbed without causing significant dilution concerns. Additionally, the speculation around political events linked to Trump continues to influence investor sentiment, adding an extra layer of interest to the token.
To this end, these factors combined suggest a favorable short-term outlook for TRUMP.
However, the price action near the lower Bollinger Band is signaling potential for further downward movement or consolidation as the price operates between key levels.
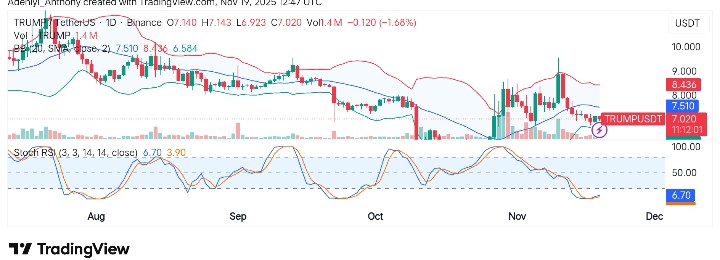
Currently, Official Trump trades at $7.020 with over 1.4 million traded volumes for the day.
Technical Indicators
Major Resistance Levels: $7.140, $7.5010, and $8.100
Major Support Levels: $7.000, $6.580, and $6.000
Technical Analysis
Technically, Official Trump against Tether appears to be poised for a potential breakout as the price operates above the lower Bollinger Bands around $6.580.
Meanwhile, the Stochastic RSI beneath the chart shows the price may be heading up in the coming session, as the lines suggest bullish traders want some gains.
However, the volume bar shows there has not been enough pressure from both market participants, as the chart shows no clear signs. To this end, a break above $7.140 or below $6.580 would determine the next direction.
Having some support here, but not really showing good signs of strenght.
I think we may visit a little lower before a bigger bounce.
– Weekly level at 6$ is something to watch (if we break down)$TRUMPCOIN pic.twitter.com/pYnDsUBxh5
— Aleksander.TraderX (@alekstraderx) November 18, 2025
Meanwhile, @alektradex suggested that $Trump may be having good support at the current level. However, the token to the analyst seems to be showing a lack of strength, and $6.00 may be the next support to target.
TRUMP/USDT Analysis: A Short-Term Sell Pressure or What?
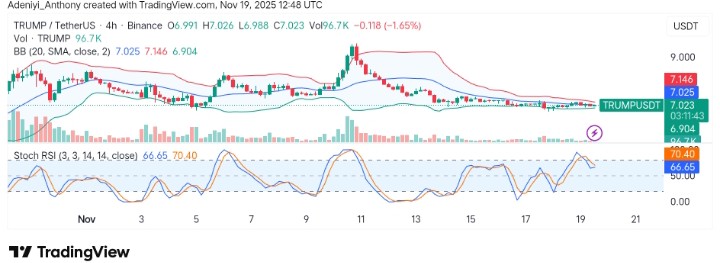
On the 4-hour chart, TRUMP/USDT seems to be undergoing a short-term pullback, moving within key support levels. However, the stochastic RSI seems to be showing a bearish crossover. As it stands, this indicates the overall price action is under pressure from recent resistance.
Meanwhile, the price is currently hovering within a narrowed Bollinger gap, awaiting a sudden move once momentum resumes.
To this end, the SRSI is near 78.67, suggesting that the coin is nearing overbought territory. A potential bearish divergence or price correction could be on the horizon.
You can purchase crypto coins here. Buy Crypto