Litecoin (LTC/USD) Market Volatility Index Relaxes at $190
Estimated Reading Time: 3 minutes
Don’t invest unless you’re prepared to lose all the money you invest. This is a high-risk investment and you are unlikely to be protected if something goes wrong. Take 2 minutes to learn more
Litecoin Price Prediction – October 26
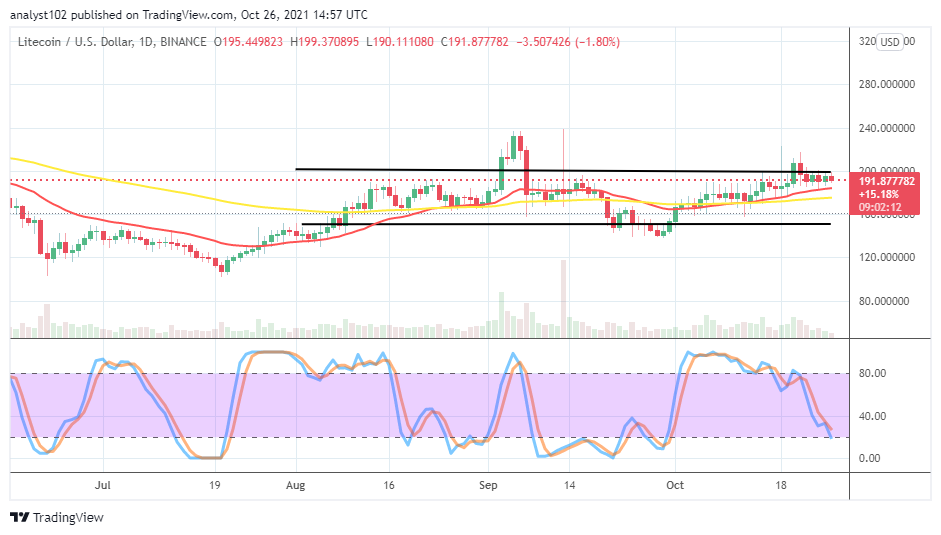
It has been on a longer-term that the LTC/USD market volatility index relaxes around the level of $190 near the upper range line. The crypto economy trades around $191 as of writing, at a relative negative percentage rate of about 1.80. That indicates that a downward force is taking place presently.
LTC/USD Market
Key Levels:
Resistance levels: $210, $230, $250
Support levels: $150, $140, $130
LTC/USD – Daily Chart
The LTC/USD daily chart shows that the crypto-economic market volatility index relaxes around $191 has been typical differential smaller-higher lows beneath the range upper range line at $200. The 14-day SMA indicator is over the 50-day SMA indicator. And they are beneath the current trading zone. The Stochastic Oscillators have moved southbound to touch the range of 20. That indicates that some degrees of momentum are losing to the downside.
Is the LTC/USD range-bound trading pattern valid presently as the market volatility index relaxes at $190?
There have been fewer active activities around the upper range line at $200 as the crypto-economic market volatility index relaxes at $190. Despite the current slight bearish trading condition, the LTC/USD market bulls still needed to exercise some degrees of patience before making a come-back into the business operations. Visible price corrections have to occur and get exhausted at a lower trading spot before a long order can be launched.
On the downside, the LTC/USD market bears are on the verge of making the best use of their chances regarding the range-bound trading pattern but only with levities. They still have to intensify efforts by depressing the market valuation more to break through the SMAs down to the lower range line at $150. That said, traders should be cautious of late entry to avoid getting whipsawed by the market in no time.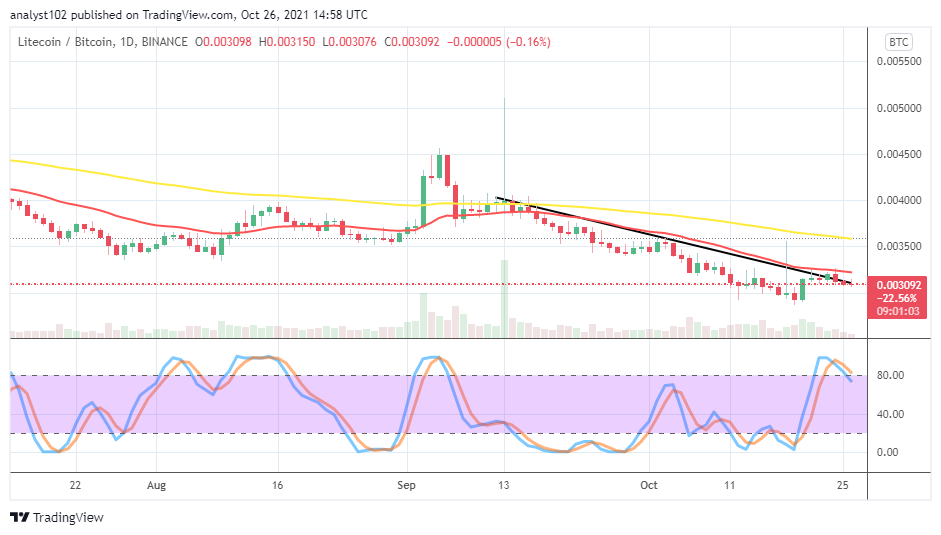
LTC/BTC Price Analysis
In comparison, Litecoin’s capacity to trend against Bitcoin is, underweighted as the duo-cryptocurrency pair market volatility index relaxes beneath the trend line of the 14-day SMA. The 50-day SMA indicator is above the 14-day SMA indicator. The bearish trend line drew alongside the smaller indicator in a supportive posture. The Stochastic Oscillators have lightly crossed the lines southbound against the range at 80. That signifies that the base crypto may still succumb to pressures as paired with the flagship cryptocurrency.
Note: Cryptosignals.org is not a financial advisor. Do your research before investing your funds in any financial asset or presented product or event. We are not responsible for your investing results.
You can purchase crypto coins here. Buy Tokens