Uniswap (UNI/USD) Price Struggles, Swinging to Average $6
Estimated Reading Time: 3 minutes
Don’t invest unless you’re prepared to lose all the money you invest. This is a high-risk investment and you are unlikely to be protected if something goes wrong. Take 2 minutes to learn more

Free Crypto Signals Channel
Uniswap Price Prediction – June 23
Over a couple of days’ sessions, it has been that the UNI/USD market price struggles, swinging to average the $6 trading line. The crypto economy, as of writing, is trading around $5 at a positive percentage rate of 10.20.
UNI/USD Market
Key Levels:
Resistance levels: $6, $8, $10
Support levels: $4, $3, $2
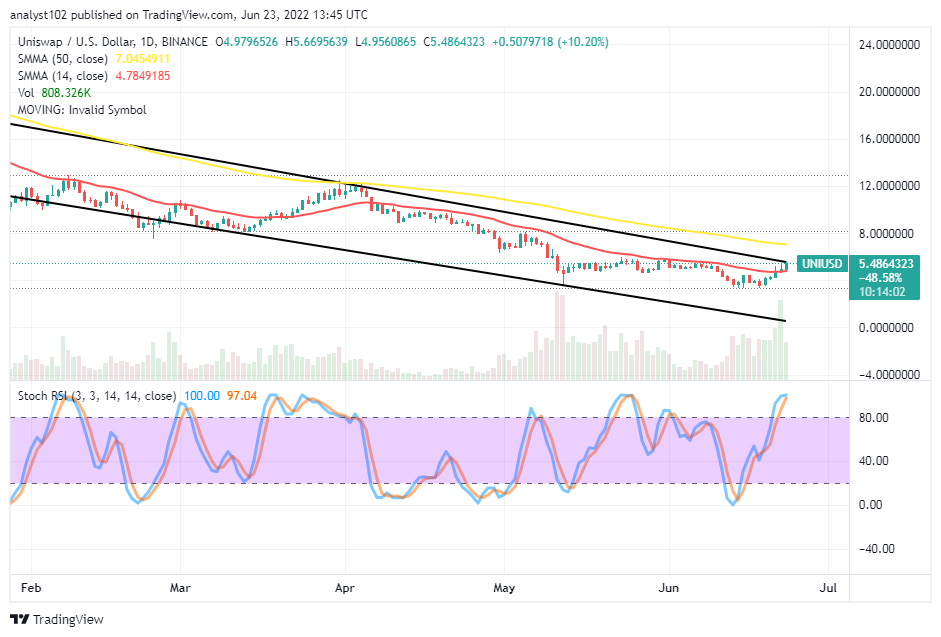
UNI/USD – Daily Chart
The UNI/USD daily chart showcases the crypto-economic price struggles, swinging to average the $6 resistance level. The 14-day SMA trend line is underneath the 50-day SMA trend line. The upper bearish trend line is drawn southward between the SMAs to mark down the likely psychological spot that the price may go back down, having satisfied a high-trading force. The Stochastic Oscillators are in the overbought region, showing an attempt to close their lines.
Will the UNI/USD market resume downsizing as it struggles to swing upward presently?
Expectantly, the UNI/USD market may soon resume downsizing, probably the resistances of $6 and $8 as the crypto’s price struggles, swinging to an average of $6. The subsequent buying forces may feature on a lighter mode not different from a ranging style. While that assumption is playing out, getting a new buying entry will be difficult. As a result, it would be ideally technical to stay off from exerting new buying positions.
On the downside of the technical analysis, the UNI/USD market bears may have to exercise patience until a bearish candlestick emerges around the $8 resistance level. There has been an overbought reading condition in the market activities, suggesting that short-position takers can begin to look out for the area of rejections at a high-trading spot before considering launching a sell order. A fearful breakout against the other higher variant resistances tends not to sustain afterward.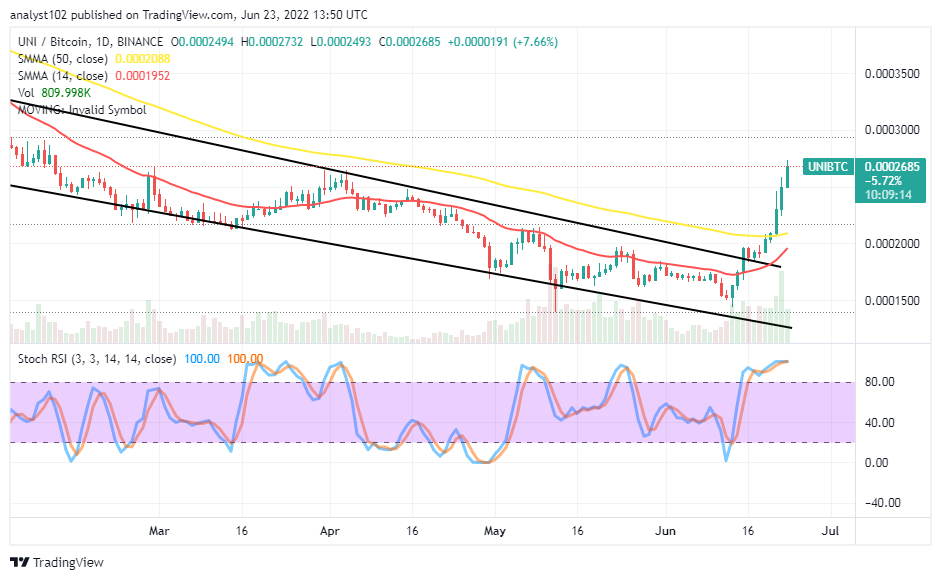
UNI/BTC Price Analysis
In comparison, the price analysis chart showcases that Uniswap has been trending higher against Bitcoin as it has broken past the indicators to the upside trading spot until the present. The cryptocurrency pair price pushes high, swinging to average other higher-resistant trading levels. The 14-day SMA indicator has crossed northward against the upper bearish trend line to move closely beneath the 50-day SMA indicator. The Stochastic Oscillators are in the overbought region with their lines clogged, moving in a consolidation manner to suggest the base crypto is settling an enabling recovery motion outlook against the counter-trading crypto.
Note: Cryptosignals.org is not a financial advisor. Do your research before investing your funds in any financial asset or presented product or event. We are not responsible for your investing results.
“Lucky is up more than 50% today but still more than 430% from All Time Highs!
The opportunity to bank BIG is now!
You can purchase Lucky Block here. Buy LBlock