DeFi Coin Price Prediction: DEFC/USD Rallying Again, Takes Support From $0.12
Estimated Reading Time: 3 minutes
Don’t invest unless you’re prepared to lose all the money you invest. This is a high-risk investment and you are unlikely to be protected if something goes wrong. Take 2 minutes to learn more

Free Crypto Signals Channel
The DeFi Coin price prediction would continue to form higher as the coin prepares to follow the bullish movement.
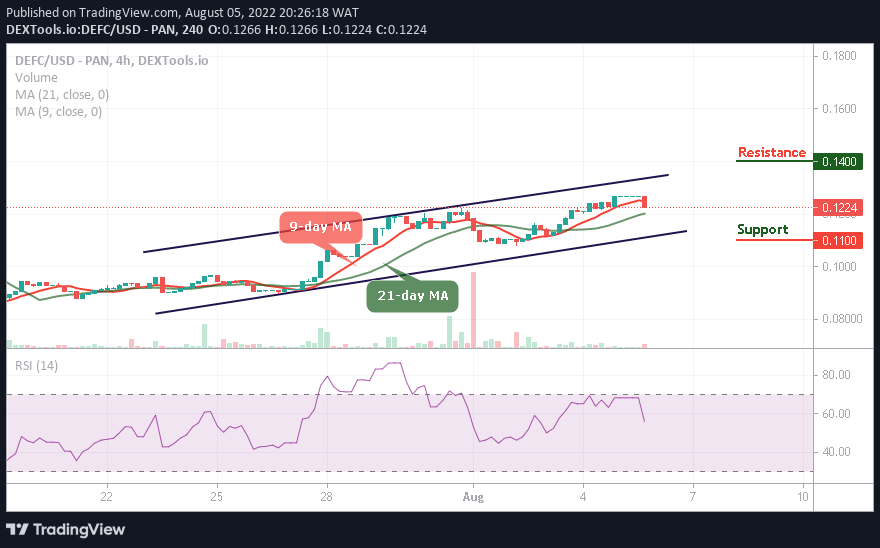
DEFC/USD Medium-term Trend: Bullish (4H Chart)
Key Levels:
Resistance levels: $0.14, $0.15, $0.16
Support levels: $0.11, $0.10, $0.09
DEFC/USD is sliding below the 9-day moving average, but it’s yet to get to the 21-day moving average. The market price is hovering at $0.122, and it could retreat more to allow new investors to come into the market.
DeFi Coin Price Prediction: DEFC/USD Will Retrace Back to the Top
According to the 4-hour chart, the DeFi Coin price will make a retracement back above the 9-day and 21-day moving averages as soon as the bulls defend the $0.12 level. However, any further bullish movement could push the coin above the upper boundary of the channel which will hit the potential resistance levels of $0.14, $0.15, and $0.16.
In the meantime, this technical analysis could be delayed if the bears break towards the lower boundary of the channel and could fall to the support levels of $0.11, $0.10, and $0.09. Similarly, the technical indicator Relative Strength Index (14) remains below the 60-level to prepare the coin for the bullish movement in the next positive direction.
DEFC/USD Medium-term Trend: Ranging (2H Chart)
Looking at the 2-hour chart, the DeFi Coin price is below the 9-day and 21-day moving averages. This is for the new buyers to come into the market and the existing buyers to re-invest. However, the long-term moving averages will begin the bullish movement as the market prepares for a new trend.
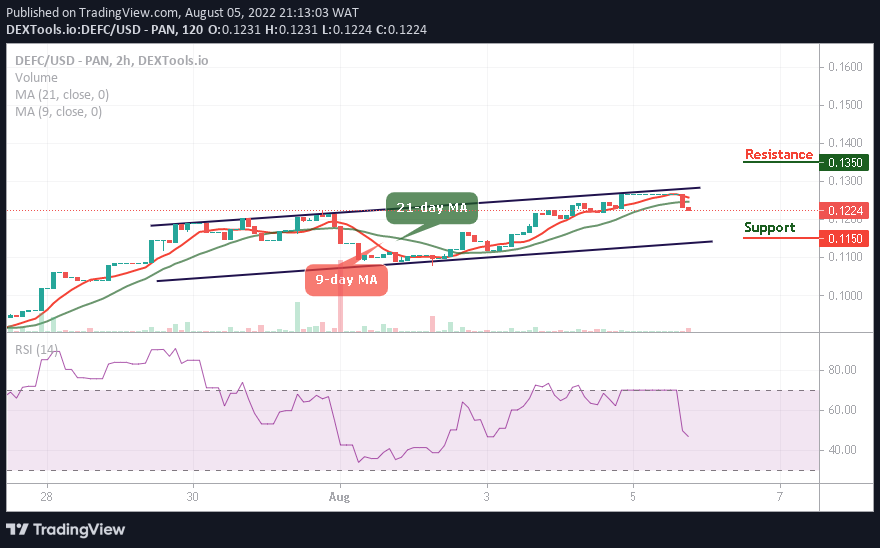
Moreover, if the buyers push the price above the upper boundary of the channel, higher resistance could be located at $0.135 and above while the technical indicator Relative Strength Index (14) stays below the 50-level. Moreover, should the bulls fail to move the current market value above, the bears could bring the coin to the support level of $0.115 and below.
You can purchase DeFi Coin here. Buy DEFC