Eigenlayer (EIGEN/USDT) Approaches Critical Breakout Zones
Estimated Reading Time: 3 minutes
Don’t invest unless you’re prepared to lose all the money you invest. This is a high-risk investment and you are unlikely to be protected if something goes wrong. Take 2 minutes to learn more

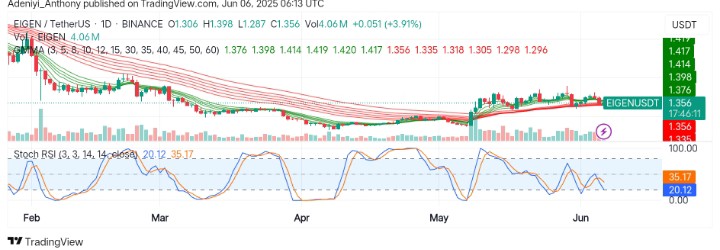
The market for EigenLayer against the Tether has shown a notable shift in recent after a prolonged downtrend. The pair’s price appears to be consolidating above the Guppy Multiple Moving Averages (GMMAs) as an early signal of bullish recovery becomes visible.
However, the Stochastic RSI seems to be stating otherwise, facing a downtrend as the price shows no significant uptick at the current position despite a 3.91% volume increase seen on the daily chart.
Currently, Eigenlayer trades at $1.356, printing over 4 million traded volumes for the day.
Technical Indicators
Major Resistance Levels: $1.398, $1.414, and $1.420
Major Support Levels: $1.335, $1.318, and $1.290
EigenLayer Technical Analysis
On the daily timeframe, Eigenlayer against the Tether appears to be ranging tightly within tightened GMMAs as the short-period EMAs hold above the long-period EMAs. This suggests an early bullish sign as the pair’s value sees a new lower high.
However, the Stochastic oscillator beneath the chart shows the pair’s momentum is dropping, approaching the oversold zone. The lines of the oscillator are reading below the midpoint level, and only a bullish crossover can trigger upside momentum.
To this end, with increased volumes, traders can monitor a close above $1.400 for a confirmed bullish breakout movement. Conversely, if the $1.398 did not materialize, the sideways movement might continue.
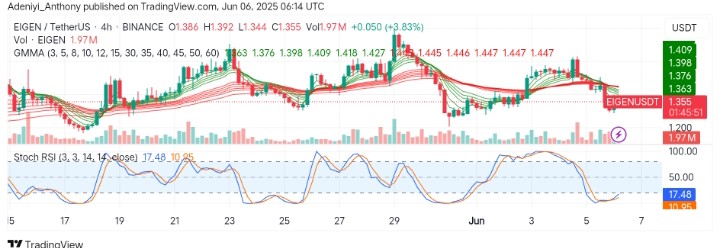
EIGEN/USDT Analysis: Breakout from Where?
On the 4H chart, EIGEN/USDT displays a short-term bearish dip after facing a rejection of around $1.440. A retracement below the GMMAs immediately followed this as the price struggled to hold above the minor support level.
From another angle, the Stochastic RSI suggests a renewed hope might be on the horizon, as the lines appear to be giving a signal of a potential upside movement, as the volume indicates no panic sell-off or confirmation.
To this end, the price must reclaim $1.376, and a break beyond $1.398 would suggest a move towards $2.000.
You can purchase crypto coins here. Buy LBlock