BNB Projects Towards $651.8 in a Strong Upside Movement
Estimated Reading Time: 3 minutes
Don’t invest unless you’re prepared to lose all the money you invest. This is a high-risk investment and you are unlikely to be protected if something goes wrong. Take 2 minutes to learn more

BNB Long-term Analysis: Bullish
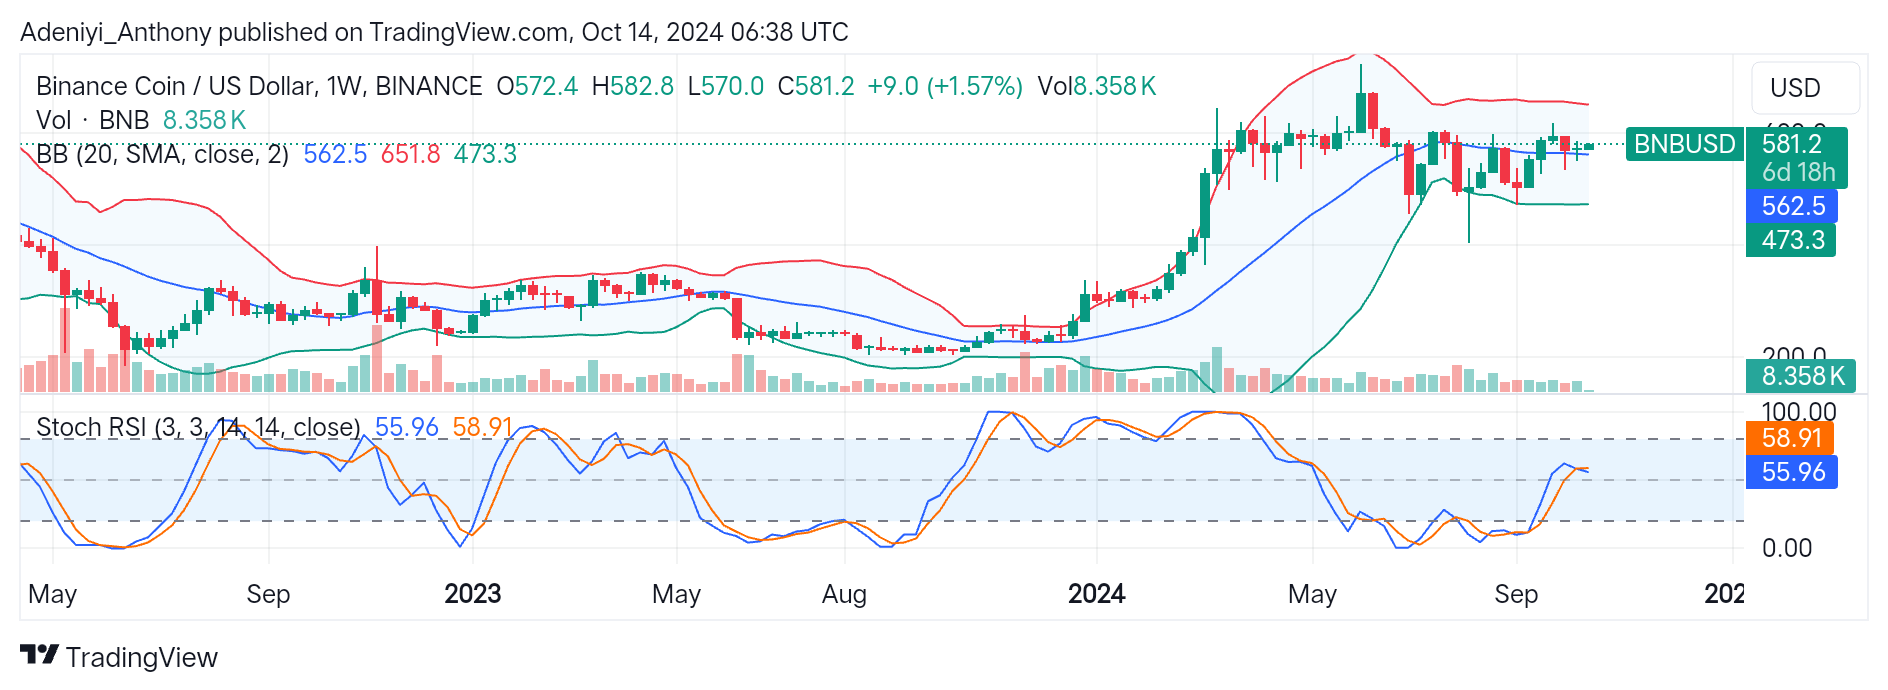
BNB, the native coin of the Binance exchange against the U.S. dollar on a weekly timeframe, has appeared to be bullish since the beginning of 2024. However, the pair’s upside trajectory has stopped, with the pair refraining from a consolidation move around the middle Bollinger band.
The pair’s recent price suggests it is aiming for the $651.8 level after a dip in recent weeks. However, the upside movement looks promising; the bands squeeze slightly, indicating volatility could soon increase.
The current weekly candle has gained 1.5% from the previous trade. This uptick is supported by a moderate trading volume of 8.358K, which reflects the consistent market activities of bullish traders.
BNB appears to be at a critical juncture. The presence of the pair in between the middle and the upper Bollinger suggests bullishness. If BNB/USD can break above the $600 psychological level, then movement at the upper level is confirmed. However, there might be some kind of pullback as suggested by the Stochastic RSI. Currently, BNB trades at $581.2.
Technical Indicators
Major Resistance levels: $600, $651.8, and $700
Major Support Levels: $473.3, $500, and $562.5
BNB Technical Indicator Analysis
The current price action of the BNB against the dollar in between the upper segment of the bands suggests moderate bullishness. On the chart, the bands appear to be squeezing, which signals an impending increase in volatility. If the price holds above the $562.5 level, the bullish trend will continue; otherwise, a reversal is possible.
In like manner, the Stochastic RSI suggests an upward trajectory, except that the pair is nearing the overbought region. This indicates caution, as a short-term pullback is expected before the continuation of the movement to the North.
BNB Price Movement: An upside Movement or a short-term Pullback
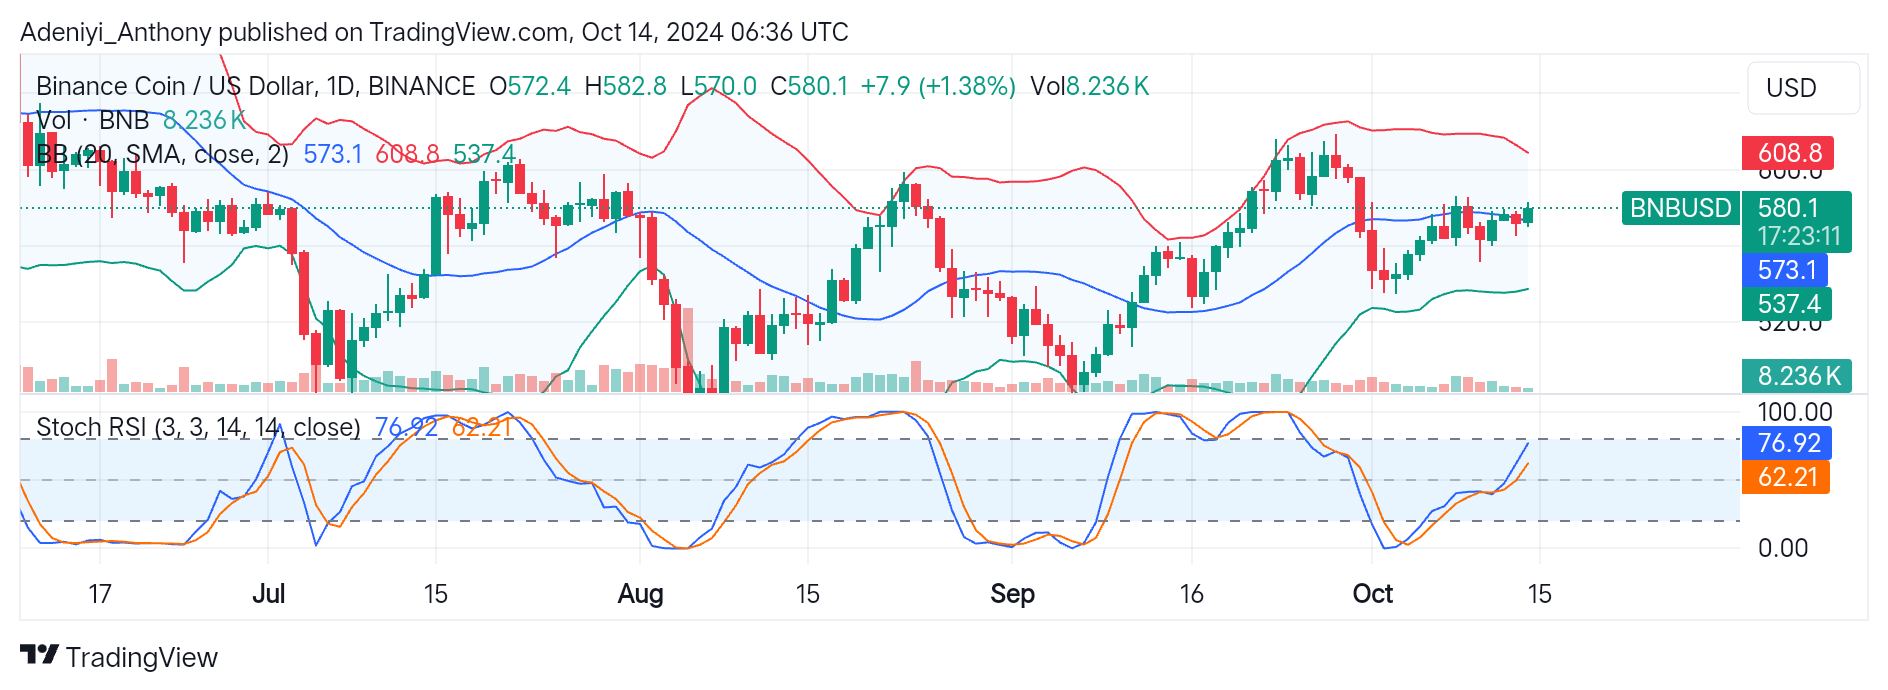
On the daily timeframe, the price of BNB/USD is slightly above the middle Bollinger band, suggesting a strong bullish move towards the higher levels. However, the pair will have to test the $580 and $600 psychological levels before advancing further.
On the downside, the Stochastic oscillator also pictures the pair gaining bullish momentum but near the overbought region. This indicates the possibility of a reversal or range-bound movement.
In conclusion, BNB appears to be in a short-term bullish position near an overbought zone, according to the oscillator. Traders should watch out for a potential resistance level at $608.8 or a reversal if the price fails to clear the $580 level.
You can purchase crypto coins here. Buy LBlock