Binance Coin (BNB) Targets $654.5 Upper Band Level
Estimated Reading Time: 3 minutes
Don’t invest unless you’re prepared to lose all the money you invest. This is a high-risk investment and you are unlikely to be protected if something goes wrong. Take 2 minutes to learn more
Binance Coin Long-term Analysis: Ranging
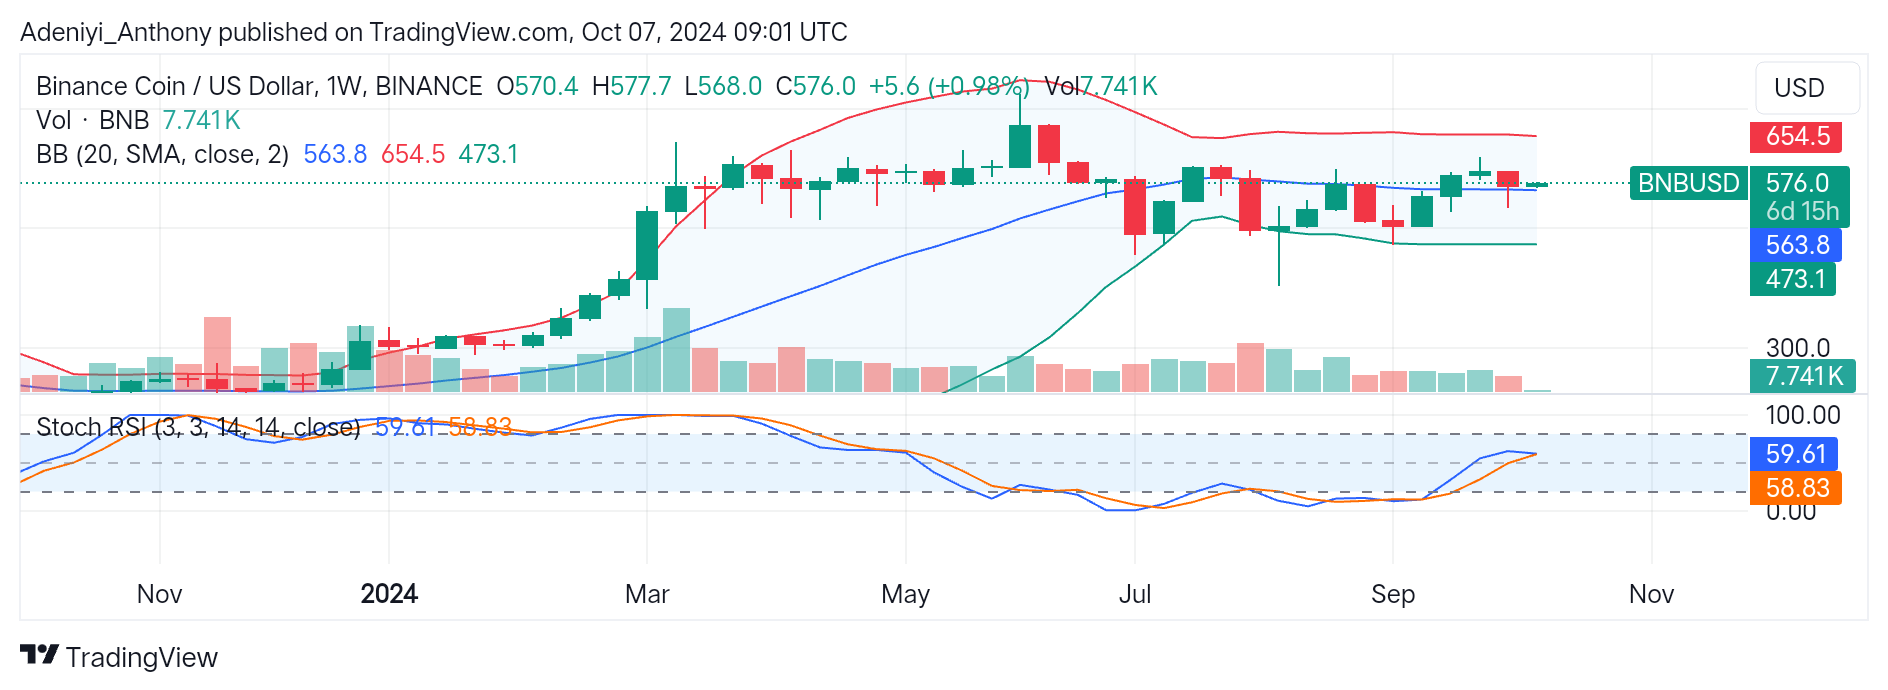
The general market sentiment for the Binance coin (BNB) against the United States Dollar appears to be consolidating, as indicated by the contraction of the Bollinger bands. The increasing bullish pressure in the market suggests the pair can reach $654.5.
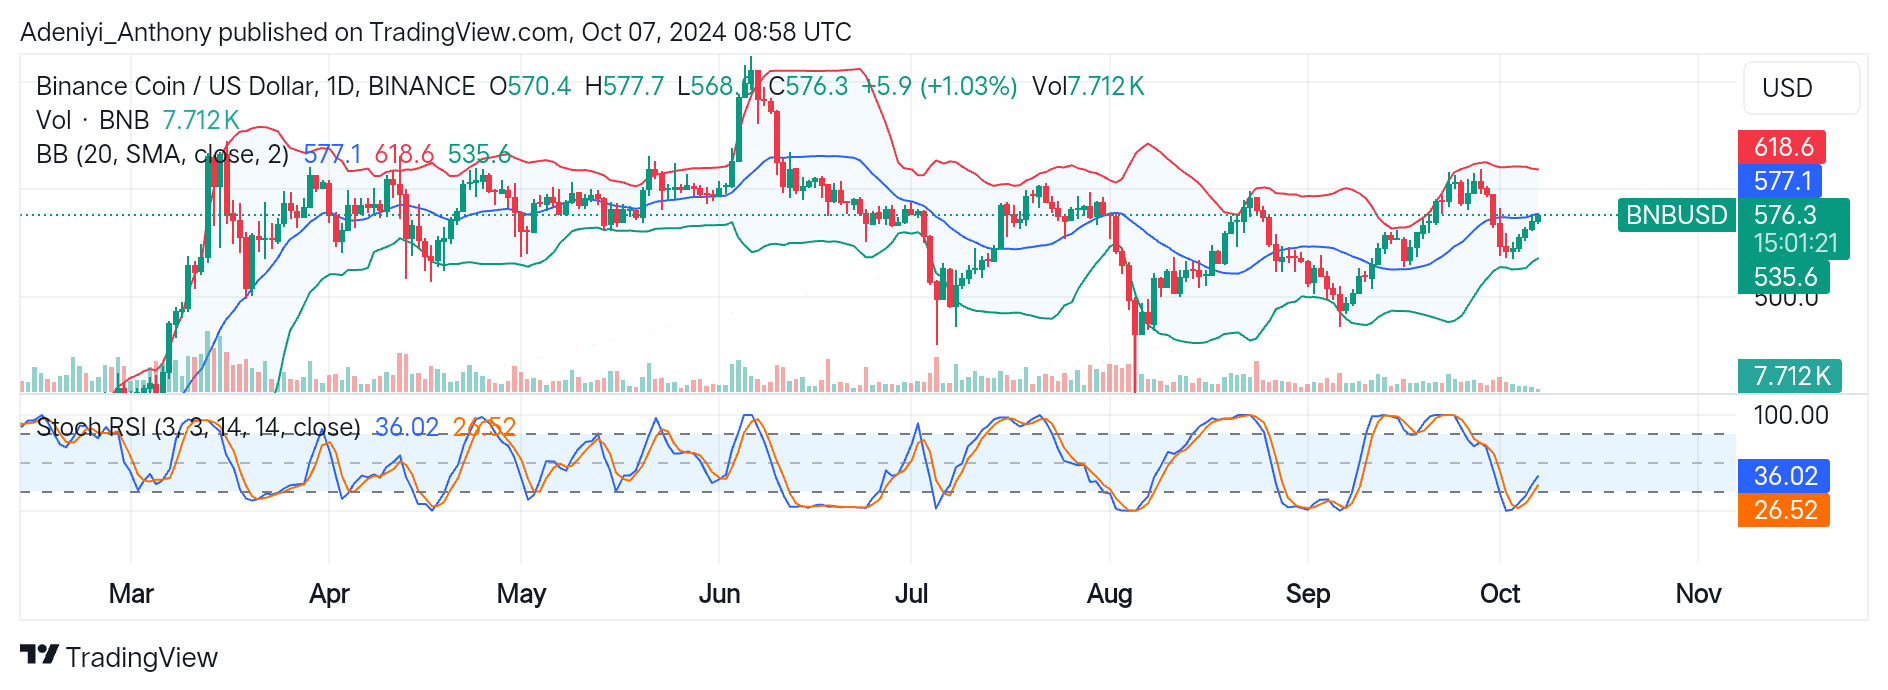
Over the last few weeks, the price of the coin has been fluctuating with short corrections. However, recent price actions suggest movement to the North, as the pair is trading over the mid-bollinger band. This is a sign of recovery and a positive trend from the recent low of around $473.
The Stochastic Relative Strength Index (RSI) operates at the mid-level, suggesting there is still room for more bullish operations. Conversely, if the bulls fail to continue this trend, it may lead to a price correction below the middle band and consequentially aiming for the $473 level. Currently, the Binance coin trades at $576.
Technical Indicators
Major Resistance Levels: $577.7, $620.0, and $654.5
Major Support Levels: $563.8, $473.1, and $420.0
BNB Technical Indicator Analysis
BNB/USD is currently consolidating, though trading above the middle band (20-week SMA) at $563.8. This can be considered slightly bullish with room for further uptrend towards $654.5. On the contrary, if the price fails to maintain this trend above the middle band, the pair may experience a short-term pullback.
The Stochastic RSI suggests the pair is operating in the neutral zone. However, the formation of bullish candlesticks expresses optimism that the pair can reach the upper band level.
Binance Coin: Where From Here?
BNB/USD on the daily chart appears to be in a recovery phase from the recent downtrend around $535.6. The Bollinger bands suggest the pair aims for the upper band as it recently bounced off the lower boundary. The price actions depict one oscillating between the upper and lower bands. This time, it operates just below the middle band; if the price breaks the level, then correction to the upside is possible. On the other hand, if the price fails to break above the level, then a short-term pullback to the lower level is possible.
On the downside, the position of the Stochastic RSI as it points upward suggests bullish pressure is building up in the market. However, if the price fails to break above the mid-band, it may lead to consolidation or correction to the South.
You can purchase crypto coins here. Buy LBlock