Litecoin (LTC) Price Prediction: LTC/USDT Sustains Above $66.50
Estimated Reading Time: 2 minutes
Don’t invest unless you’re prepared to lose all the money you invest. This is a high-risk investment and you are unlikely to be protected if something goes wrong. Take 2 minutes to learn more

Litecoin (LTC) Price Prediction: October 1
Recent price action in the Litecoin daily market broke through the resistance at the $66.80 price level. However, headwinds have emerged, causing the market to retrace to lower levels, but the ongoing session looks promising.
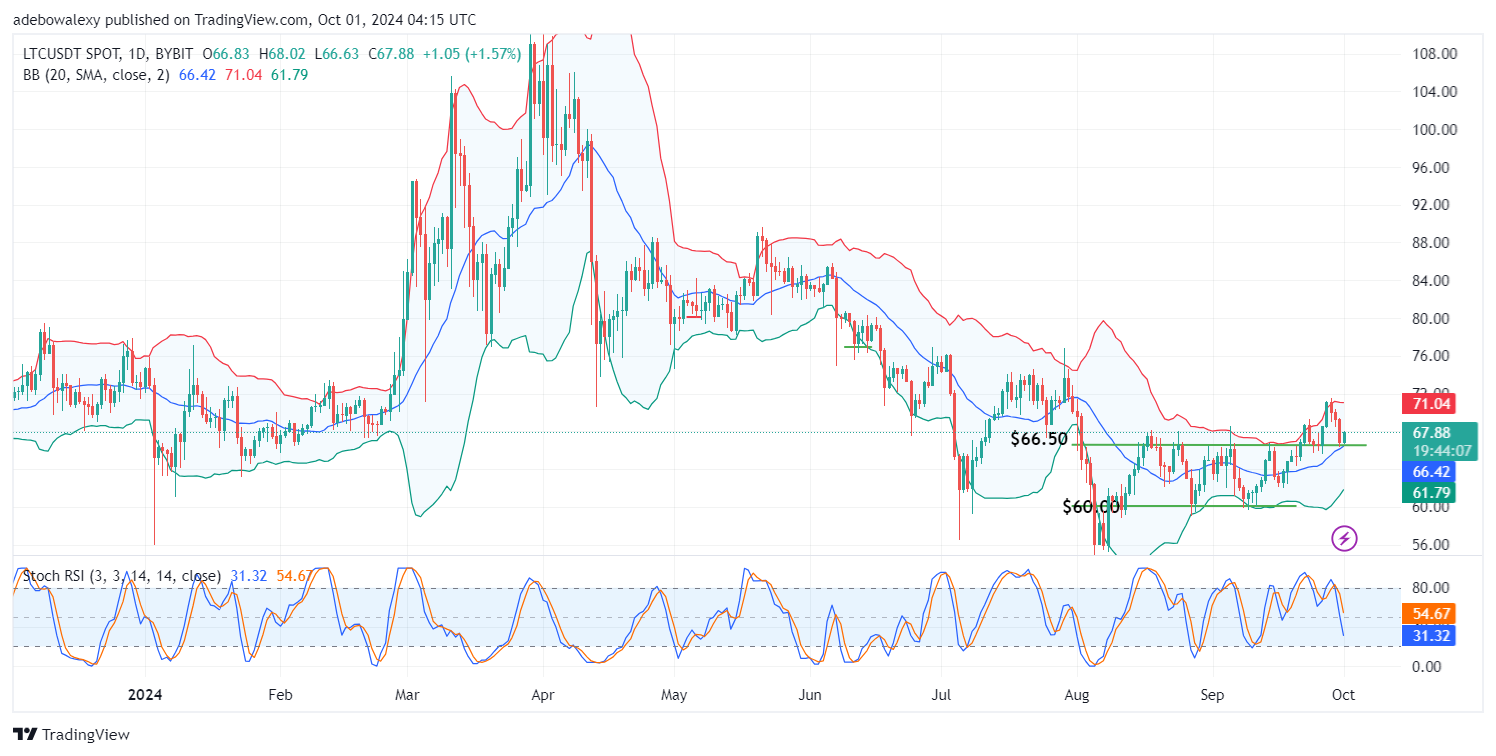
LTC/USDT Long-term Trend: Bullish (Daily Chart)
Key Price Levels:
Resistance: $70.00, $80.00, $90.00
Support: $60.00, $50.00, $40.00
The last price candle corresponding to the ongoing session stands above the $66.50 price level. This candle appears green, indicating that upward forces are leading. Additionally, this support level is close to the middle limit of the Bollinger Bands. The applied Bollinger Bands indicator is tilted upwards, while the Stochastic Relative Strength Index (Stochastic RSI) lines are plunging into the oversold region.
Litecoin (LTC) Price Prediction: LTC/USDT May Retrace to Higher Levels
Since the ongoing session in the Litecoin daily market stands atop a previous resistance level, the market suggests a possible upward retracement. From a technical perspective, trading activity has resumed an upward trajectory above a key technical landmark.
However, the Stochastic RSI still has a bearish outlook—being a lagging indicator. The lines of the indicator are seen plunging downward, largely due to prior market activities. All things considered, traders can still anticipate a continued upward retracement ahead of further confirmations.
Litecoin (LTC) Price Prediction: LTC/USDT Bulls Stay Largely Ahead (4-Hour Chart)
In the Litecoin 4-hour market, price action continues to maintain support above the $66.50 threshold. However, a new session has begun and seems to have started on a bearish path. Yet, the Stochastic RSI lines are still progressing upward despite the minimal downward retracement in the ongoing session.
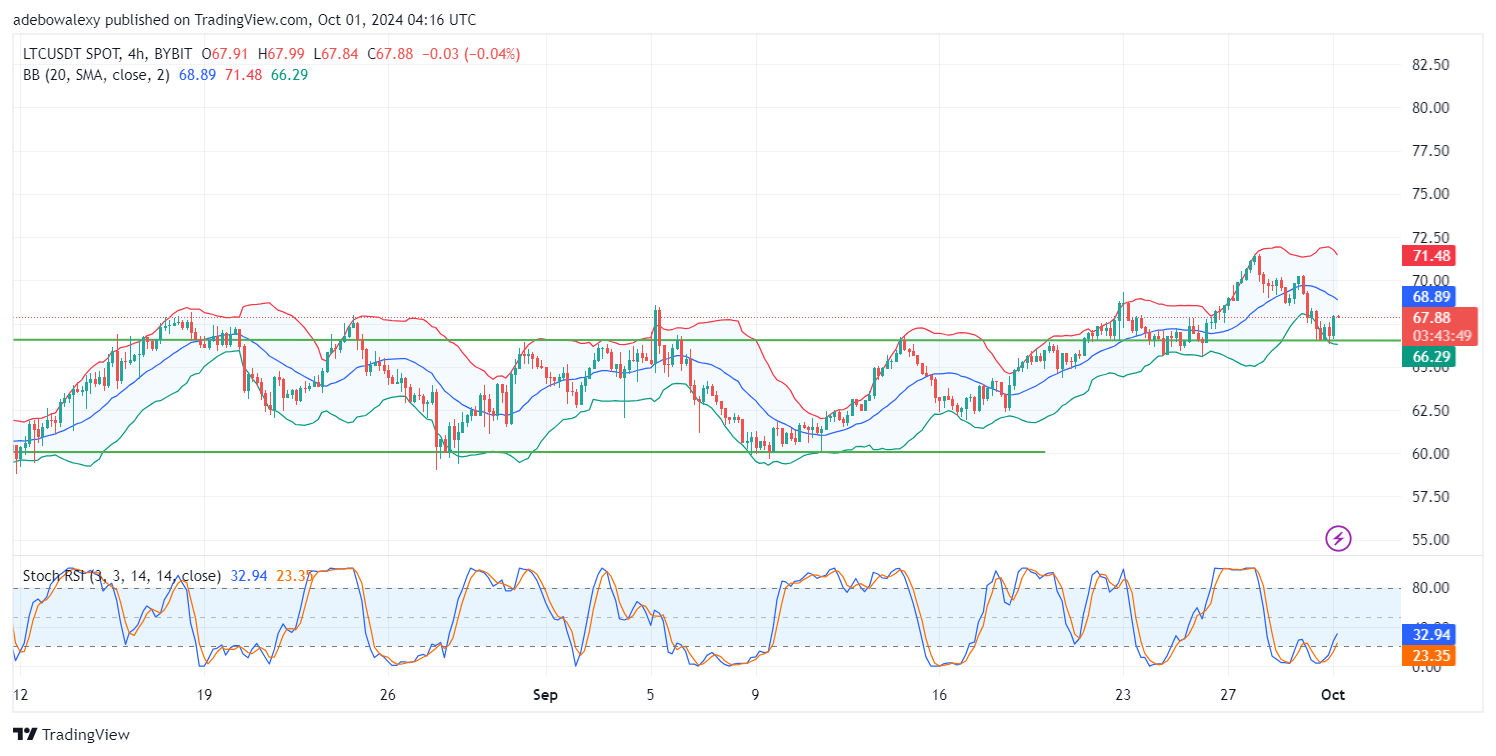
The last price candle can be seen holding near the close of the previous session. This price candle shows only minimal downward retracement, suggesting that price action can still easily shake off the minor momentum loss. This indicates that an upside correction may continue toward the $72 threshold.