BNB (BNB/USDT) Slips Below Key Moving Averages, Targets Immediate Support Levels
Estimated Reading Time: 3 minutes
Don’t invest unless you’re prepared to lose all the money you invest. This is a high-risk investment and you are unlikely to be protected if something goes wrong. Take 2 minutes to learn more
BNB Long-term Analysis: Bearish
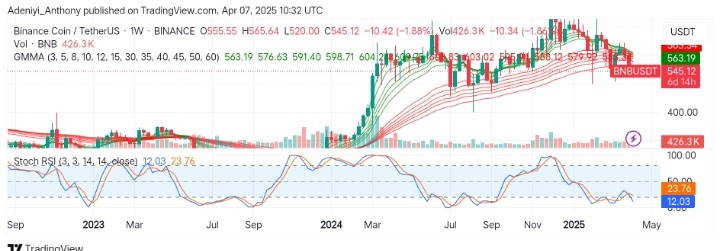
The market for BNB against the Tether has been struggling to regain momentum after hitting the peak above the cluster of moving averages, suggesting suppressing selling pressure. However, on the weekly chart, the pair has slipped below the Guppy Multiple Moving Averages (GMMAs), indicating a shift in momentum as the bears set to pull the price further south.
Recently, BNB has been showing signs of compression, signaling regained momentum within a narrow band, with the bulls struggling to push the price to the north. However, the recent sell-off accompanied by the declining volume suggests conviction among sellers, as $520 looks like the next level for the bulls to re-enter the market.
Currently, BNB trades at $545.12, recording a 1.88% loss for the week already.
Technical Indicators
Major Resistance Levels: $575.00, $603.00, and $640.00
Major Support Levels: $520.00, $490.00, and $450.00
BNB Technical Analysis
On the weekly timeframe, BNB against the Tether has experienced a shift in momentum after a prolonged period of price range within a close range. However, the current price action below the $575 level shows the pair is under intense selling pressure as the GMMAs prepare to complete a bearish crossover.
The Stochastic oscillator on the other end signals the pair is oversold, as indicated by the sets of EMAs above. However, the movement of the lines below the 30-mark level indicates further decline, with the hope of recovery soon.
BNB/USDT Analysis: Where from Here?
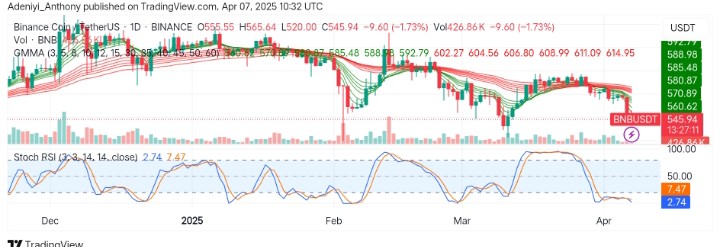
On the daily chart, BNB/USDT continues its movement below all the key moving averages, further reinforcing bearish movement. However, the appearance of the Stochastics’ lines signals an extension of the current trend, but for a short while.
To this end, the current price movement suggests cautious trade, as a break above $560 would confirm a bounce to the north; otherwise, downside continuation towards $520 is in play.
You can purchase crypto coins here. Buy LBlock