Uniswap (UNI) Price Prediction: UNI/USDT Has Equal Tendency of Breaking Out in Either Direction
Estimated Reading Time: 3 minutes
Don’t invest unless you’re prepared to lose all the money you invest. This is a high-risk investment and you are unlikely to be protected if something goes wrong. Take 2 minutes to learn more

Date: November 27, 2025
The Uniswap market has continued to trade below the $7 mark. As a result, price activity in this market keeps moving in a way that suggests that the market may break out in any direction. More details lie below.
UNI/USDT Long-Term Trend — Bearish (Daily Chart)
Key Price Levels
Resistance: $7.00, $8.00, $9.00
Support: $6.00, $5.50, $5.00
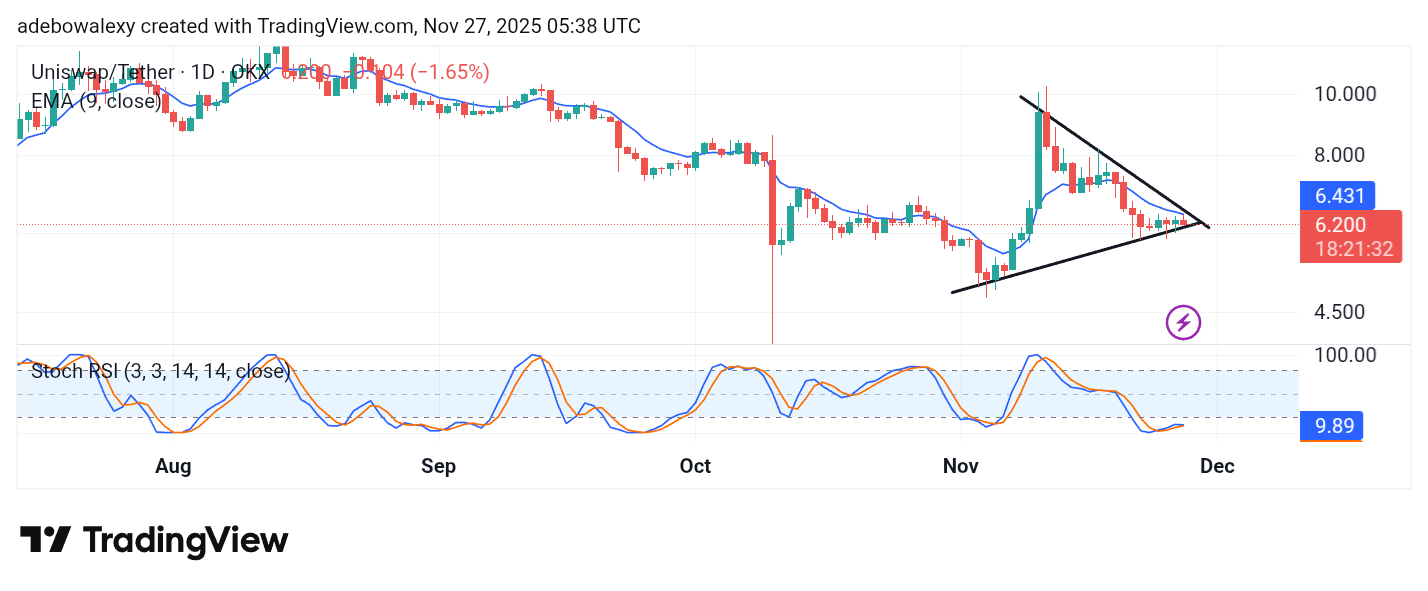
There has been only minimal movement on the Uniswap daily chart recently. Also, the ongoing session has presented very minimal bearish movement; however, it was sufficient enough to keep trading below the 9-day Exponential Moving Average (EMA) line. Also, price movement of late appears to fall into a symmetrical triangle pattern and, as such, indicates a possible breakout either downward or upward. Meanwhile, the SRSI lines have a generally upward trajectory.
Uniswap Price Prediction: UNI/USDT Keeps Traders on the Sidelines
With the Uniswap market trading in a symmetrical triangle, it seems traders will have to exercise some patience in this market. Price action remains below the 9-day EMA curve as price action moves in a sideways trajectory.
The last price candle here touches the floor of the symmetrical triangle on the chart. This tilts the market toward a bearish breakout. However, the lines of the SRSI indicator are still rising upward generally and, as such, hint that price action may proceed minimally upward. While this is in play, traders may watch for price action rising past the 9-day EMA for a more concrete sign.
Uniswap Price Prediction: UNI/USDT Possible Bearish Breakout Stays On (4-Hour Chart)
The UNI/USDT 4-hour chart reveals that price action continues to hold the higher probability of falling through the floor of the symmetrical triangle. The last price candle here remains a red price candle as it tests the lower limits of the triangle.
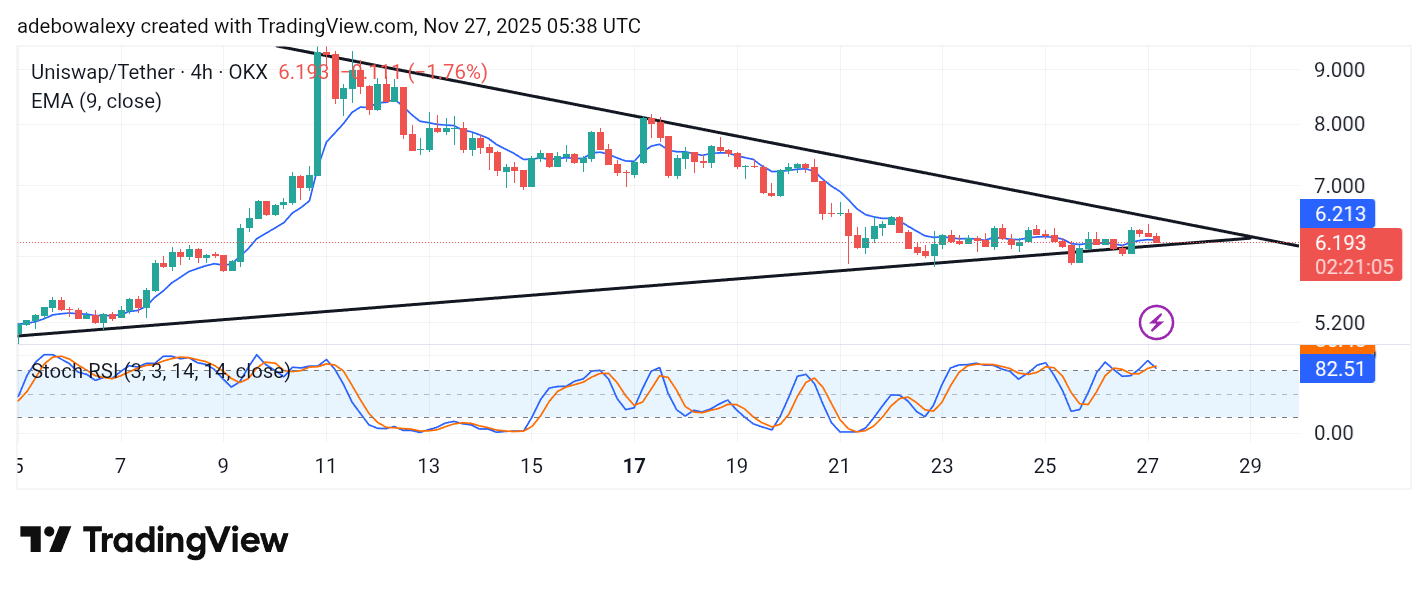
Meanwhile, the lines of the SRSI indicator have delivered a downward crossover just above the 80 mark of the SRSI indicator. The ensuing lines of the indicator have a downward trajectory following the crossover. This technically affirms the fact that price action is more inclined toward descending toward the $6.00 mark.