Uniswap (UNI) Price Prediction: UNI/USDT Stabilizes Amid Market Turbulence
Estimated Reading Time: 2 minutes
Don’t invest unless you’re prepared to lose all the money you invest. This is a high-risk investment and you are unlikely to be protected if something goes wrong. Take 2 minutes to learn more

Date: November 20, 2025
The Uniswap market has descended but not too far, even as the big market indicator — Bitcoin — keeps diving to many-month lows. However, while most altcoins were going full-blown on bearish momentum, the Uniswap market has been able to stabilize its price movement.
UNI/USDT Long-Term Trend — Bearish (Daily Chart)
Key Price Levels
Resistance: $8.00, $9.00, $10.00
Support: $7.00, $6.00, $5.00
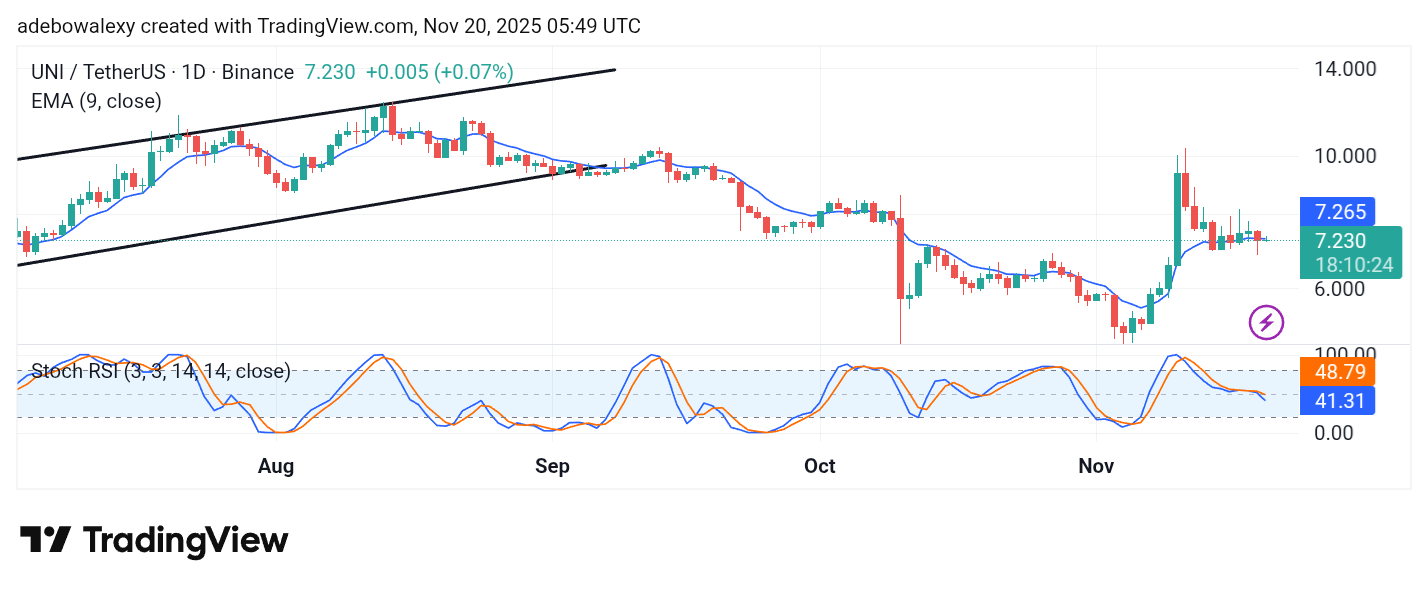
On the Uniswap 24-hour chart, price action can be seen hugging the 9-day Exponential Moving Average (EMA) line from near it. And for the most part of the recent sessions, price action has been in the green. The ongoing session has appeared slightly bullish as presented by the latest price candle on the chart. Despite this, the Stochastic Relative Strength Index (SRSI) indicator lines are still descending into the oversold region of the indicator.
Uniswap Price Prediction: UNI/USDT Lurks Around Important Technical Levels
Given the recent stance of price action in the Uniswap daily market, it appears that this market is getting some aid from buyers. This opinion emanates from the fact that price action has been mostly bullish, although not much progress was made, but it keeps price action around important technical levels.
On the contrary, the lines of the SRSI indicator are descending toward the oversold region. Be that as it may, traders might want to lean toward the fact that price action stays around important technical levels.
Uniswap Price Prediction: UNI/USDT Looks Calm and Well Positioned (4-Hour Chart)
Even on the Uniswap 4-hour price chart, it can be seen that price action stands above the 9-day EMA curve. This is so even though the last price candle on the chart is a red one, but sits above the 9-day EMA.
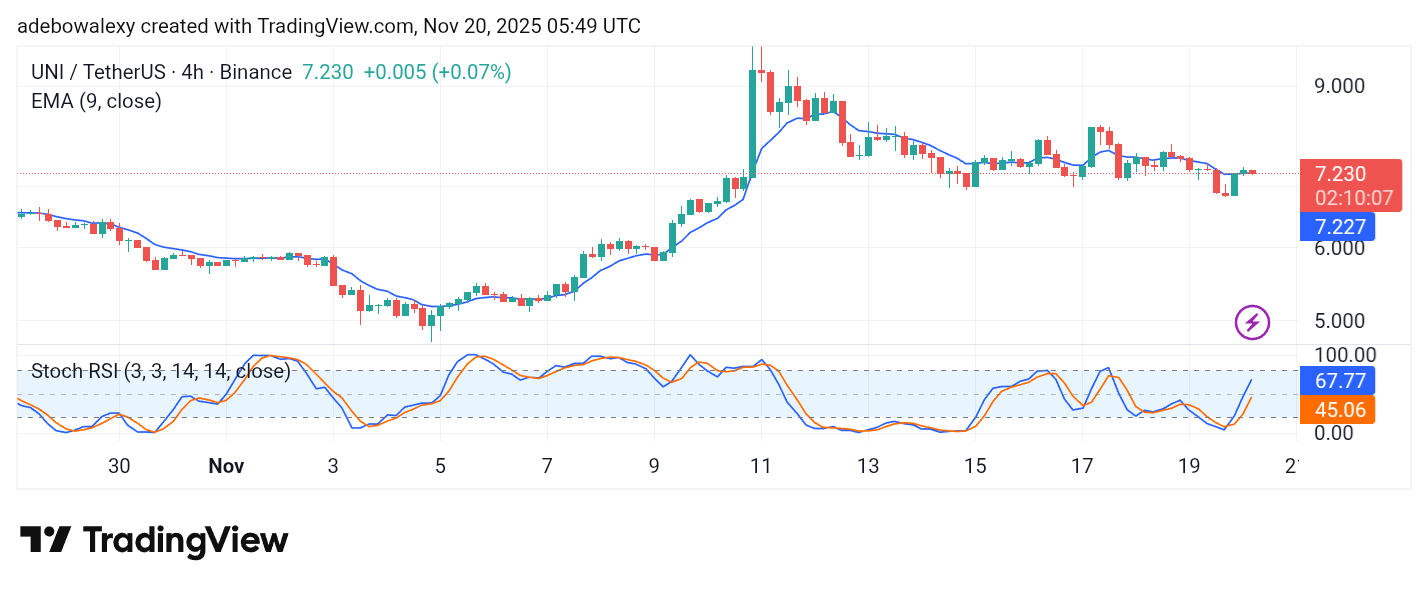
The lines of the SRSI indicator can still be seen rising steeply toward the 80 mark of the indicator. Technically, this market stays in position for a continued upward correction. Therefore, targeting the $8.50 price level may just be quite sufficient for short-term gains.