The API3 Market (API3/USD) Buyers Are Gaining the Upper Hand Within Today’s Trading Session
Estimated Reading Time: 3 minutes
Don’t invest unless you’re prepared to lose all the money you invest. This is a high-risk investment and you are unlikely to be protected if something goes wrong. Take 2 minutes to learn more
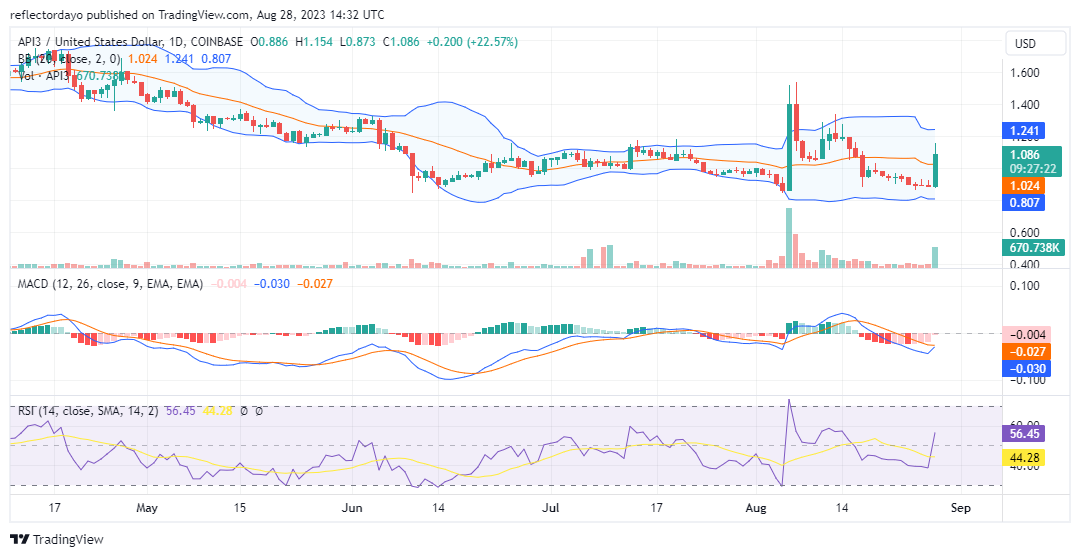
The substantial surge in buying activity on August 6 propelled the API3 market into a heightened state of volatility. The price experienced a meteoric rise, surging from the $0.86 price level and peaking at $1.5. However, this dramatic ascent was followed by profit-taking, which in turn triggered a pronounced bearish market trend that persisted from that point until the current trading session. Buyers managed to initiate a market reversal near a critical support level.
API3 Market Data
- API3/USD Price Now: $1.062
- API3/USD Market Cap: $91,570,799
- API3/USD Circulating Supply: 86,421,978 API3
- API3/USD Total Supply: 125,324,588 API3
- API3/USD CoinMarketCap Ranking: #188
Key Levels
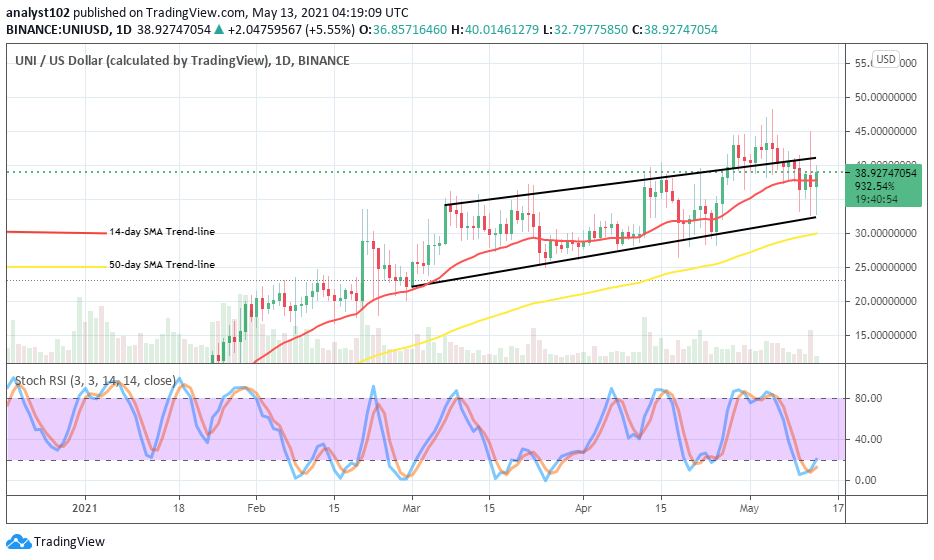
- Resistance: $27.00, $28.00, and $29.00
- Support: $23.00, $22.00, and $21.00.
Price Prediction for the API3 Market: The Indicators’ Point of View
The Bollinger Bands for the API3 market have been showing an interesting pattern. The bands have been consistently wide apart, indicating increased volatility in the market. This wide separation is likely a result of the significant price movement that occurred on August 6th. During that period, there was massive buying activity that propelled the price of API3/USD from the $0.86 price level to a peak of $1.5. This rapid ascent caused the Bollinger Bands to expand as volatility surged.
The API3/USD pair gained an impressive 21% within today’s trading session, indicating strong buying interest. However, despite this significant gain, the impact on the Bollinger Bands appears limited. This observation could be attributed to the persistently high level of volatility in the market. High volatility often leads to wider Bollinger Bands, and even substantial price movements might not cause a drastic contraction of the bands.
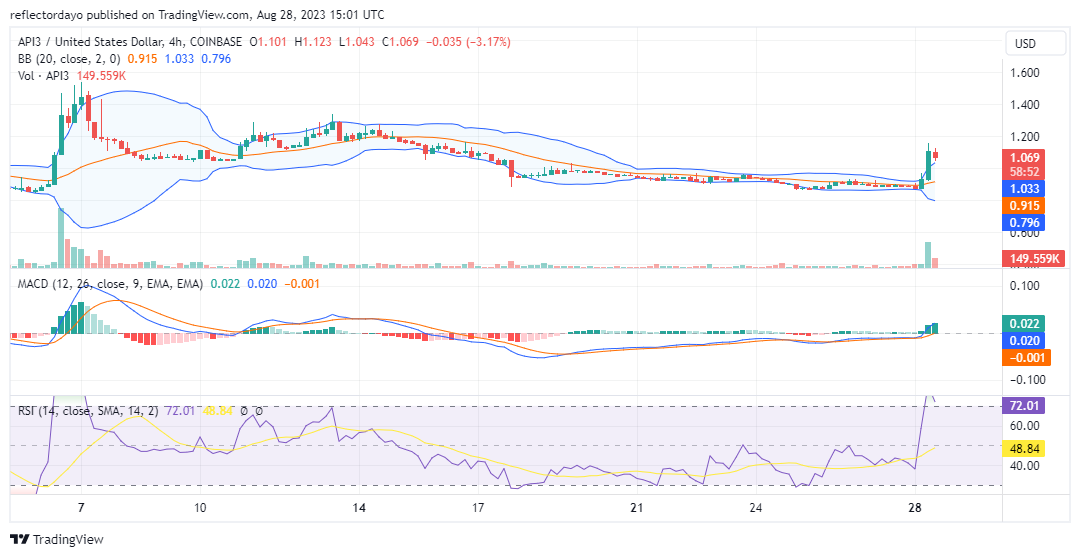
API3/USD 4-Hour Chart Outlook
In a shorter time frame, following a period of market stagnation, API3 is currently experiencing a bullish breakout. The Relative Strength Index (RSI) shows an almost vertical surge in prices, propelling the market into overbought territory. This type of price movement is likely to trigger a downward price correction as robust buying sentiment has pushed demand to exceed its intrinsic value. To sustain the upward trend, buyers should focus on establishing a solid bullish support level, which will encourage the continuation of the uptrend.