Uniswap (UNI) Price Prediction: UNI/USDT Witnesses Sharp Pullback Near $12 Mark
Estimated Reading Time: 2 minutes
Don’t invest unless you’re prepared to lose all the money you invest. This is a high-risk investment and you are unlikely to be protected if something goes wrong. Take 2 minutes to learn more

Date: August 14, 2025
The Uniswap token has breached key psychological price levels at $10 and $11. Price action earlier attempted to push through the $12 mark; however, a pullback has occurred, and the market still remains above important technical support zones.
UNI/USDT Long-Term Trend — Bullish (Daily Chart)
Key Price Levels
Resistance: $12.00, $13.00, $14.00
Support: $11.00, $10.00, $9.00
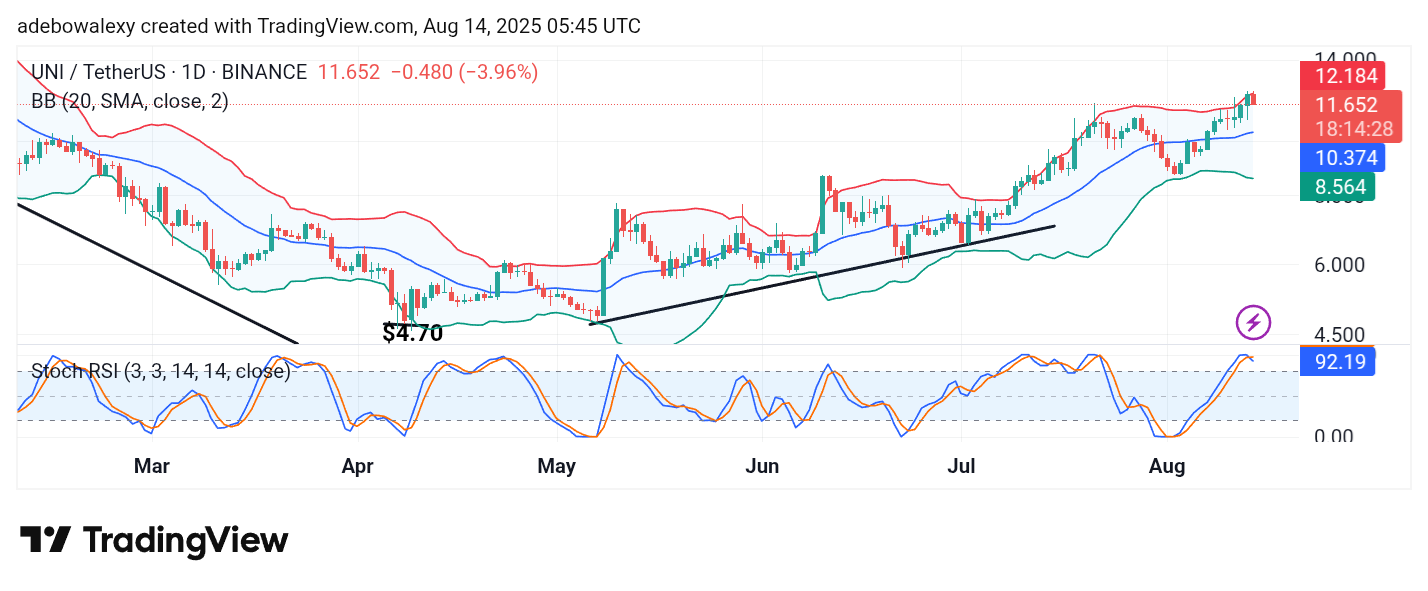
Price movement on the Uniswap daily chart remains generally bullish. The most recent price candle shows a rebound off the upper band of the Bollinger Bands (BB) indicator, with the BB itself expanding to allow further upside potential. However, the Stochastic Relative Strength Index (SRSI) lines have formed a downward crossover in the overbought zone, signaling possible short-term weakness.
Uniswap Price Prediction: UNI/USDT May Have Seen a Decisive Price Shift
Despite the recent pullback, price action in the Uniswap market remains elevated above critical technical levels. The current price candle shows only a moderate retracement after rebounding from the BB’s upper limit. Price still trades comfortably above the middle band of the BB indicator.
However, the SRSI indicator has produced a downward crossover in the overbought region, suggesting a possible shift in momentum. While this indicates potential short-term weakness, a rebound from nearby support levels remains possible.
Uniswap Price Prediction: UNI/USDT Downward Rebound Looks Threatening (4-Hour Chart)
On the 4-hour chart, Uniswap shows signs of a stronger downward correction. A large red candle has formed during the current session, though price still trades above key technical levels, including the middle band of the BB indicator.
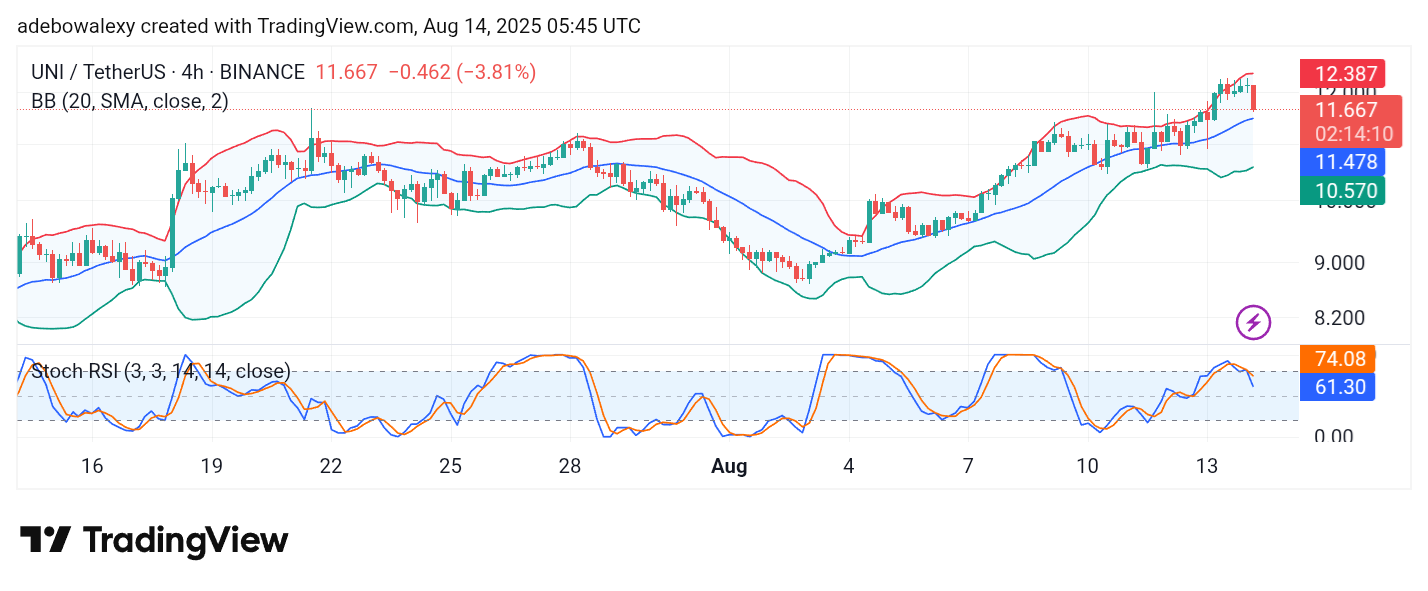
The BB maintains an upward slope, reflecting the broader bullish bias. On the downside, the SRSI crossover continues to move lower, reinforcing the possibility of further selling pressure. In the short term, traders may look for a potential bounce from the $11.50 level.