Solana Price Prediction: SOL/USDT May Hit $110 Support
Estimated Reading Time: 2 minutes
Don’t invest unless you’re prepared to lose all the money you invest. This is a high-risk investment and you are unlikely to be protected if something goes wrong. Take 2 minutes to learn more

Solana Price Prediction (April 3, 2025)
Solana has continued its downward movement from one support level to another. As of the time of writing, the token is trading below the $115 price level, with price action maintaining a tendency to decline further.
SOL/USDT Long-Term Trend: Bearish (Daily Chart)
Key Price Levels:
Resistance: $120, $125, $135
Support: $110, $105, $100
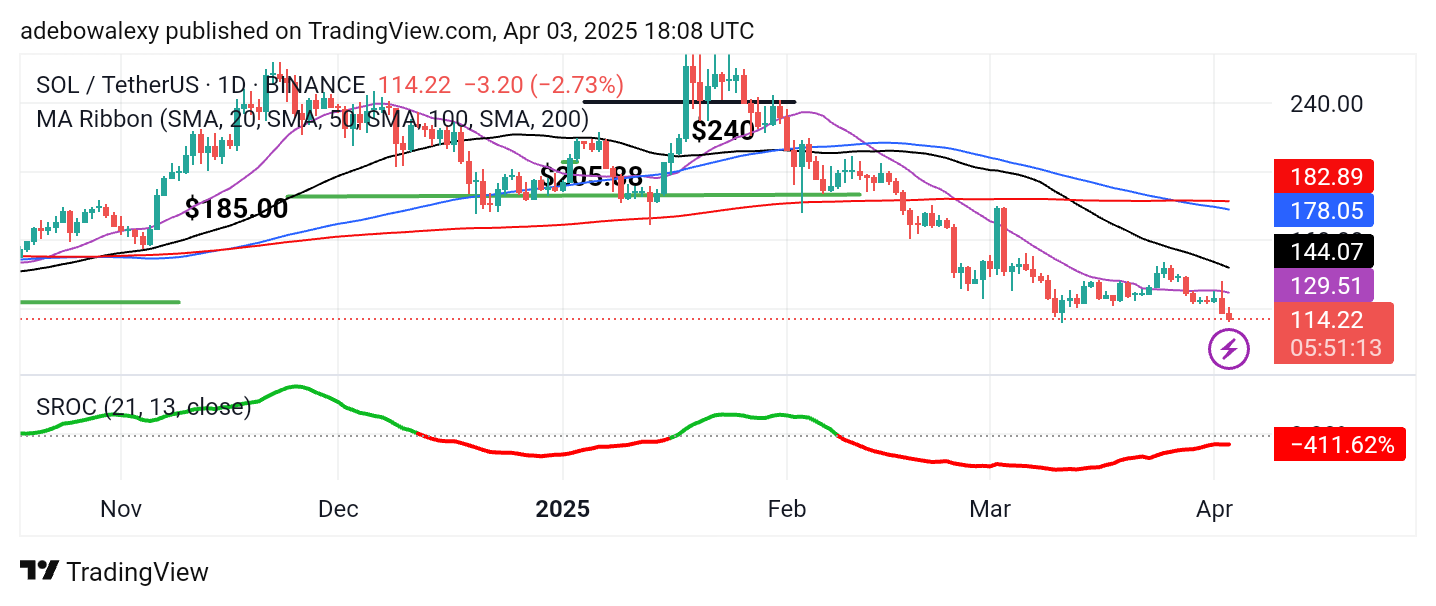
The last price candle on this daily chart appears bearish, indicating that bearish sentiment persists in the market. This is evident as trading activity continues below all the Moving Average (MA) lines. Similarly, the Stochastic Rate of Change (ROC) indicator remains sideways, with its lines positioned below the equilibrium level. Additionally, the indicator’s line remains red, signaling an oversold condition.
Solana Price Prediction: SOL/USDT Eyes Lower Psychological Support Level
Price activity in the Solana daily market suggests the possibility of further declines. Price action has continued to edge lower for the second consecutive session with moderate momentum.
As mentioned earlier, this market remains below all the MA lines, which can be seen positioned above the price action. Meanwhile, the Stochastic ROC indicator is moving sideways below the 0.00 level, currently standing at -6.75. Technically, this indicates an oversold condition, suggesting that downward pressure remains strong.
Solana Price Prediction: SOL/USDT Bears See Minimal Rejection But Remain Vulnerable (4-Hour Chart)
Even on the 4-hour Solana market, price action continues to trend lower. Similar to the daily chart, price activity remains below all the MA lines. However, the last price candle raises some suspicion that bullish forces might be attempting to resist further downward movement, as it appears green. The Stochastic ROC clearly exhibits a downward trajectory below the equilibrium level.
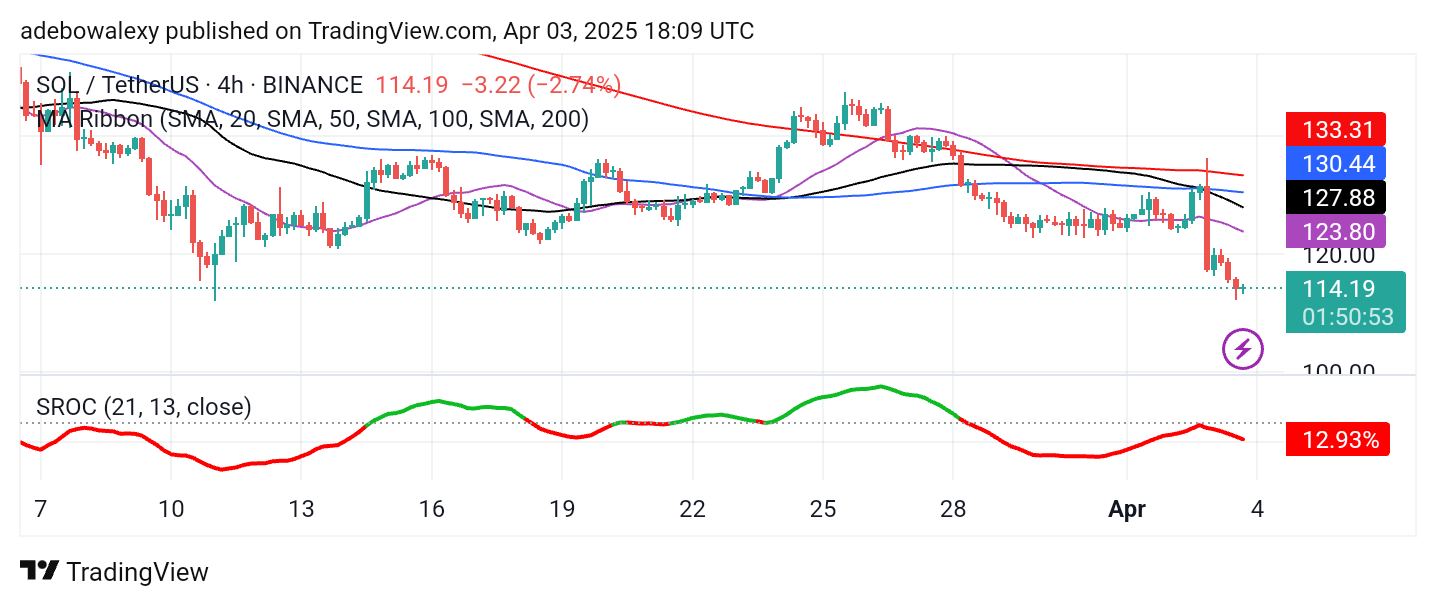
With price action at a considerable distance below all the MA lines, an uptrend is unlikely to form easily. However, traders should monitor market fundamentals that could trigger a shift in direction. For now, the market appears to be heading toward the $110 price level.