Uniswap Price Prediction: UNI/USDT Continues to Consolidate Around the $5.68 Baseline
Estimated Reading Time: 3 minutes
Don’t invest unless you’re prepared to lose all the money you invest. This is a high-risk investment and you are unlikely to be protected if something goes wrong. Take 2 minutes to learn more

Uniswap Price Prediction (April 3, 2025)
Price activity in the Uniswap daily market continues to lack a strong catalyst that could counteract bearish sentiments. As a result, the token’s price action has been consolidating around the $5.68 level in recent times.
UNI/USDT Long-Term Trend: Bearish (Daily Chart)
Key Price Levels:
Resistance: $6.00, $6.50, $7.00
Support: $5.50, $5.00, $4.50
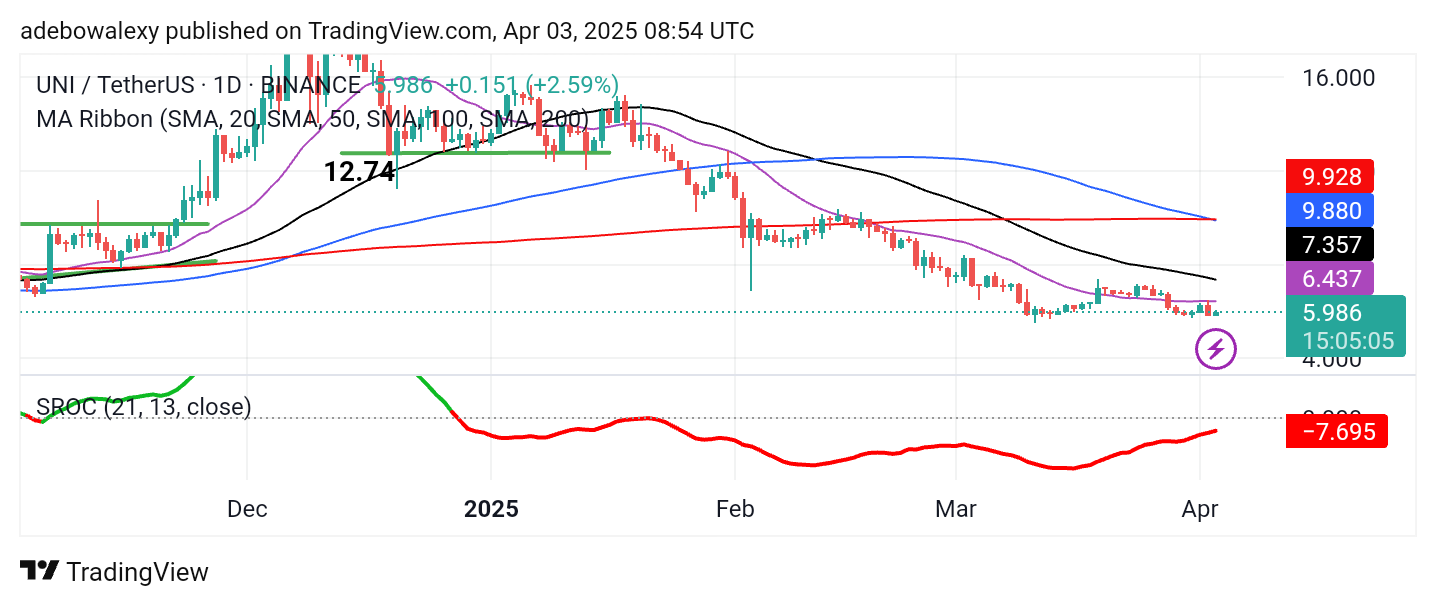
Recently, Uniswap’s price action fell below the 20-day MA line last Friday and has remained below this technical level ever since. The current trading session has formed a small green price candle. Simultaneously, the Stochastic Rate of Change (ROC) indicator lines are positioned below the equilibrium level and appear red. However, the indicator’s trajectory suggests a slight upward retracement may be underway.
Uniswap Price Prediction: UNI/USDT Market Faces an Uphill Battle
The Uniswap market requires a fresh wave of momentum to shift sentiment in its favor. Recently, the token’s price action has been hovering below all moving average (MA) lines on the chart. However, the latest price candle is green and is positioned just below the 20-day MA.
Additionally, the Stochastic ROC indicator is moving upward toward the 0.00 level from below this threshold. The indicator’s line remains red, suggesting that the asset is currently oversold. Given this setup, traders may want to take a cautious approach, waiting for the market to rise above key MA levels before considering long positions.
Uniswap Price Prediction: UNI/USDT Attempts to Maintain Key Technical Levels (4-Hour Chart)
On the 4-hour Uniswap chart, bullish forces are attempting to keep price action near important technical levels. In previous sessions, the price tested the 20-day MA as resistance, but subsequent attempts have failed to surpass this mark. The latest price candle is green but shows only minimal upward movement, keeping price action below the 20-day MA.
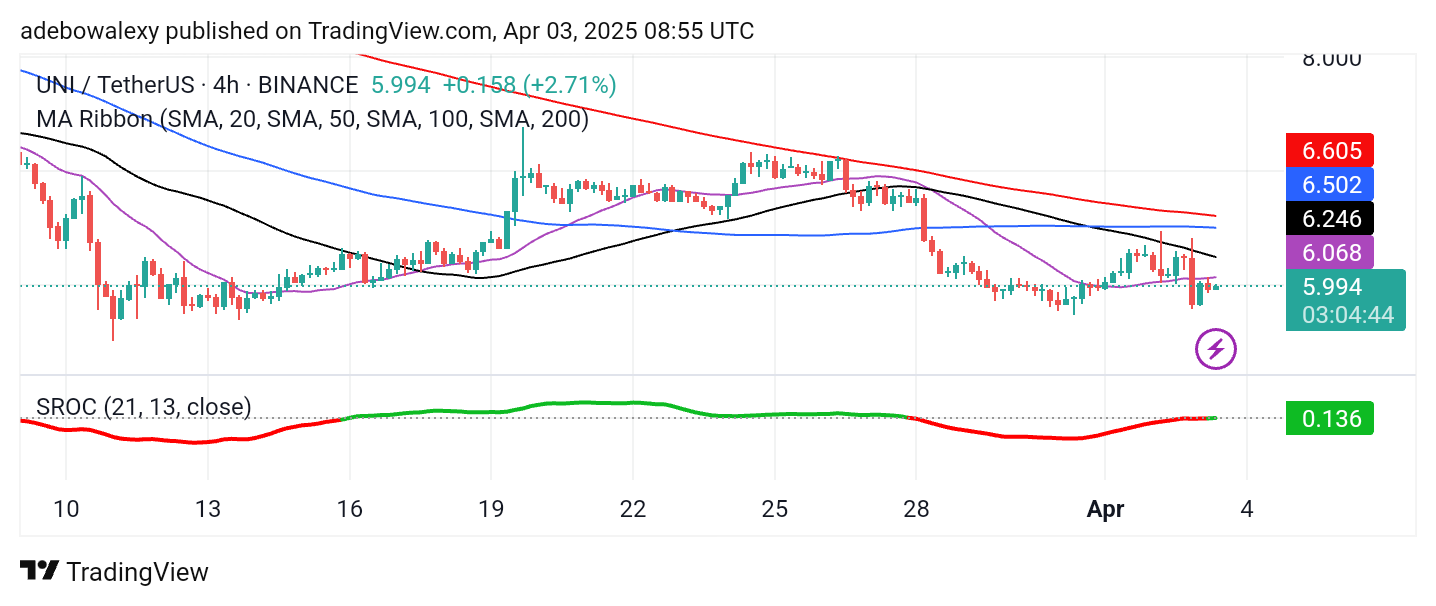
Meanwhile, the Stochastic ROC indicator lines have turned green and are now positioned sideways at the 0.00 level. Since the indicator is hovering just above this threshold, traders may consider targeting short-term gains around the $6.00 level.