dYdX Market (DYDX/USD) Secures Strong Support at $0.30
Estimated Reading Time: 3 minutes
Don’t invest unless you’re prepared to lose all the money you invest. This is a high-risk investment and you are unlikely to be protected if something goes wrong. Take 2 minutes to learn more

The dYdX market experienced intense volatility throughout October, with price movement predominantly trending downward. This resulted in a significant sell-off that dragged the token from the $0.60 region down to the $0.30 level—marking a substantial 50% decline from its October peak.
Since October 10, bearish sentiment has remained aggressive, with sellers attempting to push the market even lower. However, the dYdX bulls have consistently defended the $0.30 support zone, preventing further downside pressure. With this defensive stance holding firm, early signs now suggest that bullish momentum may be building, potentially setting the stage for a price rebound.
dYdX Market (DYDX/USD) Market Data
- DYDX/USD Price Now: $0.309
- DYDX/USD Market Capitalization: 253.6 million
- DYDX/USD Circulating Supply: 806.7 million DYDX
- DYDX/USD Total Supply: 958 million DYDX
- DYDX/USD CoinMarketCap Ranking: #156
Key Levels to Watch
- Resistance: $0.40, $0.50, $0.60
- Support: $0.25, $0.20, $0.15
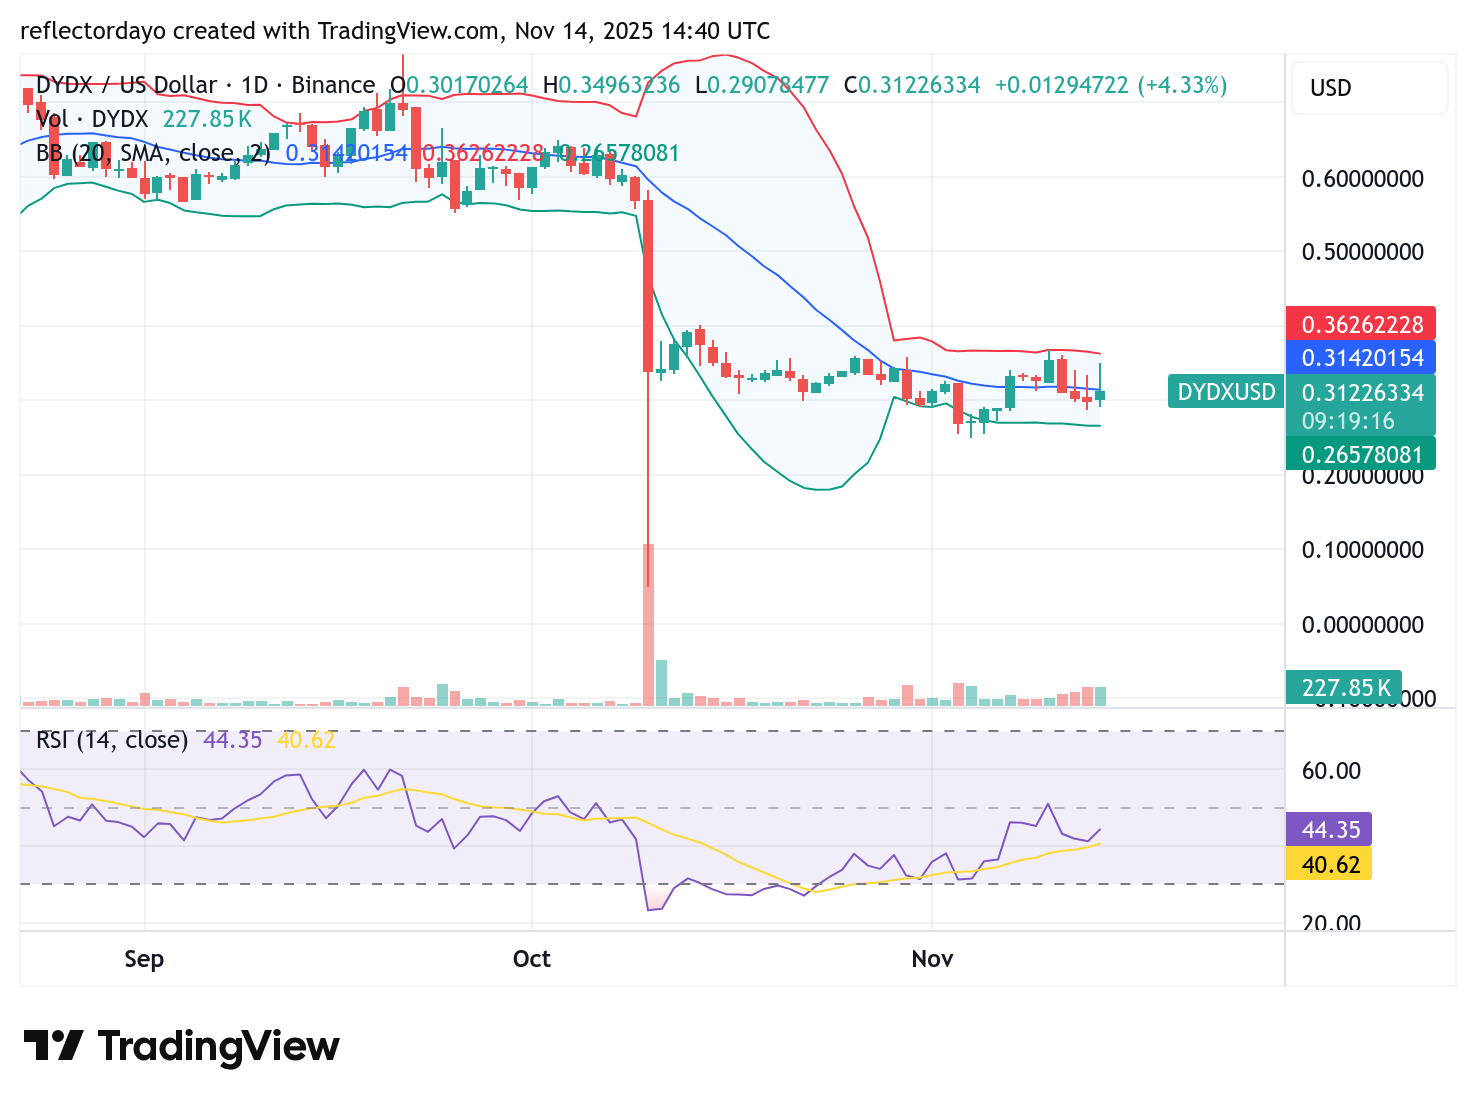
dYdX Market (DYDX/USD) Daily Chart
Following the breakdown to the $0.30 region, the bulls have consistently defended this level, keeping price action mostly above it despite continued bearish pressure. Sellers have repeatedly tested lower zones, and in a recent attempt, the price briefly slipped below $0.30—finding temporary support around the $0.25 mark. This support level triggered a rebound that pushed the market back above the $0.30 threshold.
The Bollinger Bands currently display a narrow, horizontal range, reflecting the subdued volatility and sideways movement dominating the market. Despite today’s performance still leaning toward bearish sentiment, there are emerging signs of potential exhaustion on the bearish side. This is indicated by the appearance of shooting star candlesticks forming at the lower end of the market—quite different from when they appear at the top of an uptrend (which typically signals a reversal). In this context, the pattern suggests waning momentum among the bears and the possibility that a shift may soon occur.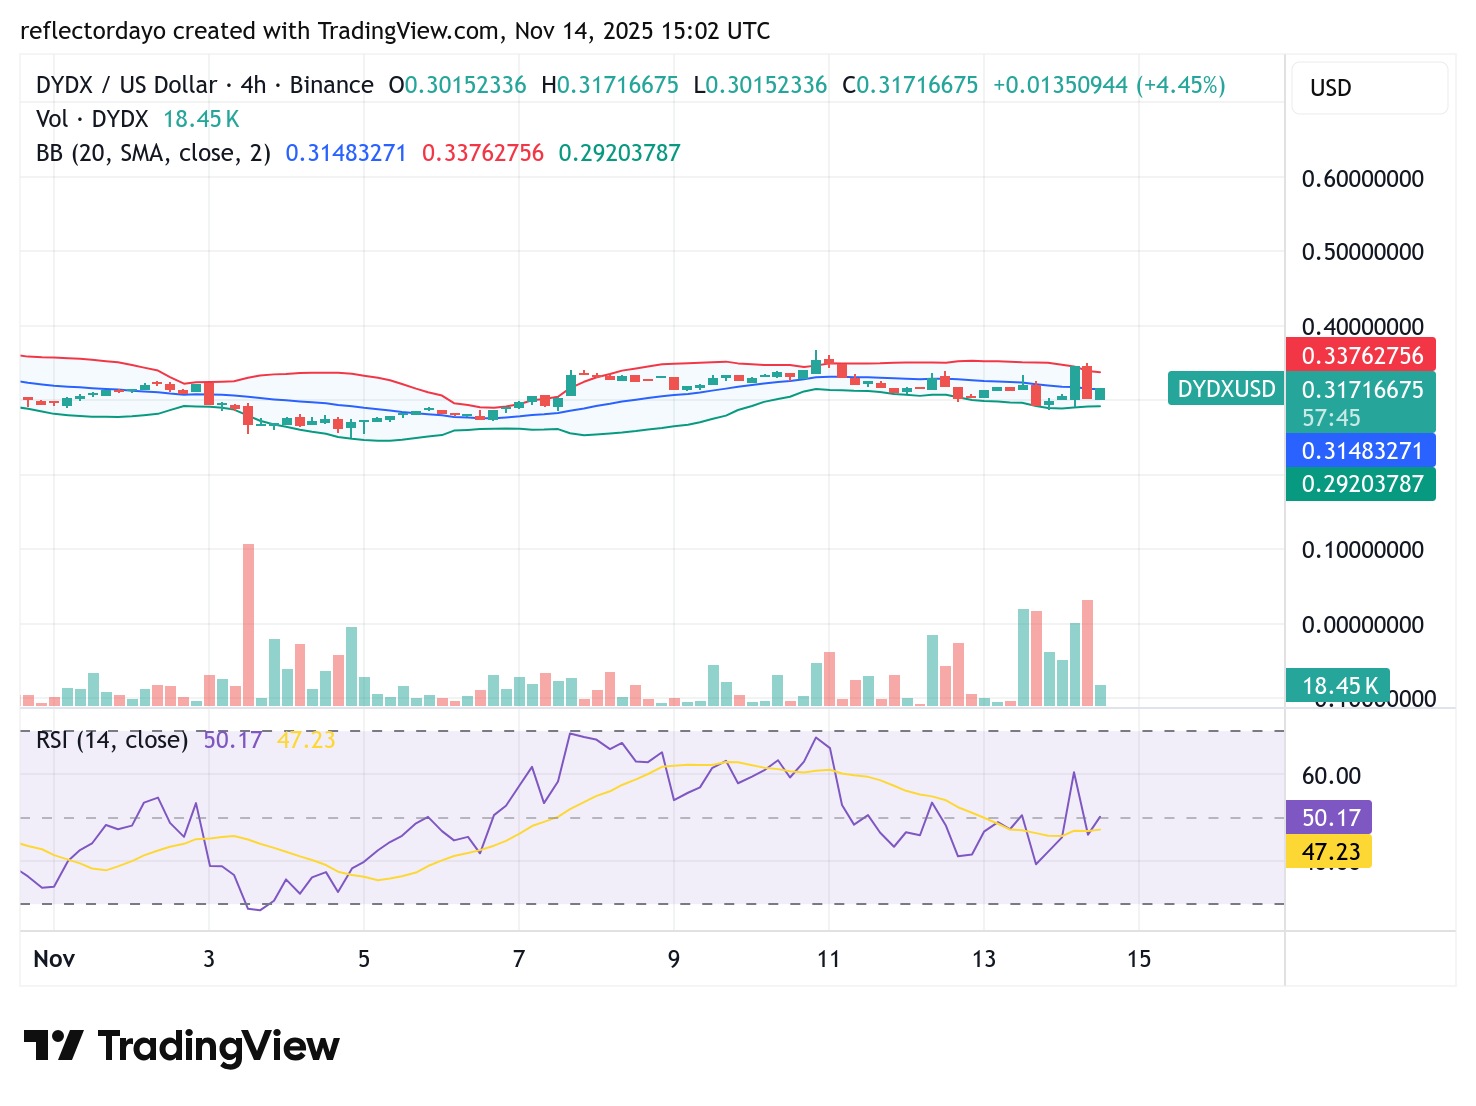
DYDX/USD 4-Hour Chart Outlook
During the earlier trading sessions today, bullish momentum briefly took control, pushing the price up toward the $0.346 level before encountering strong resistance. This rejection caused the market to retrace sharply back to the $0.30 threshold.
Recent trading volumes indicate heightened activity; however, as both resistance and support continue to hold firm, the market is showing signs of indecision. This uncertainty is reflected in the noticeable decline in trading volume during the ongoing session. Overall, the DYDX/USD market remains in a consolidation phase as traders await a clearer directional breakout.