Uniswap (UNI/USD) Finds Higher Support at $7.5
Estimated Reading Time: 2 minutes
Don’t invest unless you’re prepared to lose all the money you invest. This is a high-risk investment and you are unlikely to be protected if something goes wrong. Take 2 minutes to learn more

In recent trading sessions, the Uniswap market has begun gaining upward traction after a period of downward movement. The bearish trend started when the market peaked at $12.00 in August and extended until it found strong support around the $5.00 level in November. The current establishment of higher support near the $7.50 price mark indicates growing bullish momentum and suggests that further upward price action may be on the horizon.
Uniswap (UNI/USD) Market Data
- UNI/USD Price Now: $7.88
- UNI/USD Market Capitalization: 4.95 billion
- UNI/USD Circulating Supply: 630.3 UNI
- UNI/USD Total Supply: 1 billion UNI
- UNI/USD CoinMarketCap Ranking: #26
Key Levels to Watch
- Resistance: $1.30, $1.40, $1.50
- Support: $1.10, $1.00, $0.90
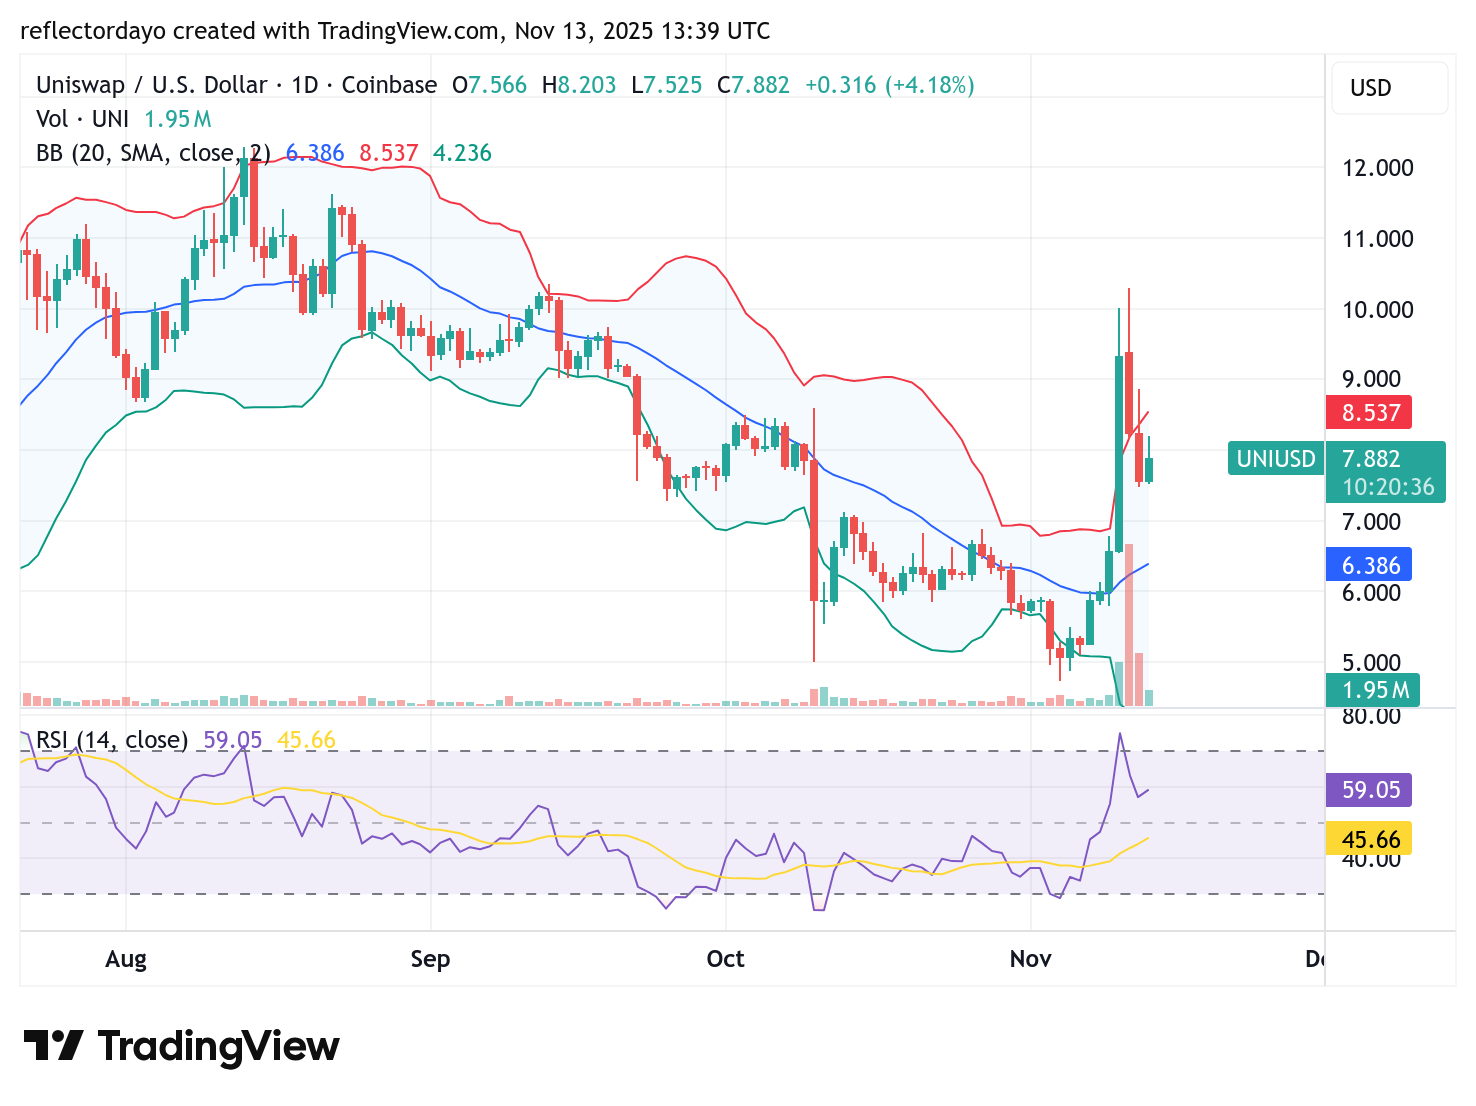
Uniswap (UNI/USD) Daily Chart
Over the past few days, the Uniswap market has exhibited a notable level of volatility. Initially, the bulls took strong control, driving the price sharply toward the $10.00 level. However, after peaking at that point, a bearish correction set in, causing a significant pullback until strong support emerged around the $7.50 price level.
While this support zone may appear encouraging for the bulls, the presence of pronounced upper shadows on the last two candlesticks suggests increasing bearish pressure against the current position. A breakdown below this support could invite further bearish momentum.
Meanwhile, the declining volume indicator, reflected by its smaller histogram bars, indicates caution from both buyers and sellers. This hesitation on both sides could lead to a period of consolidation around the current price range.
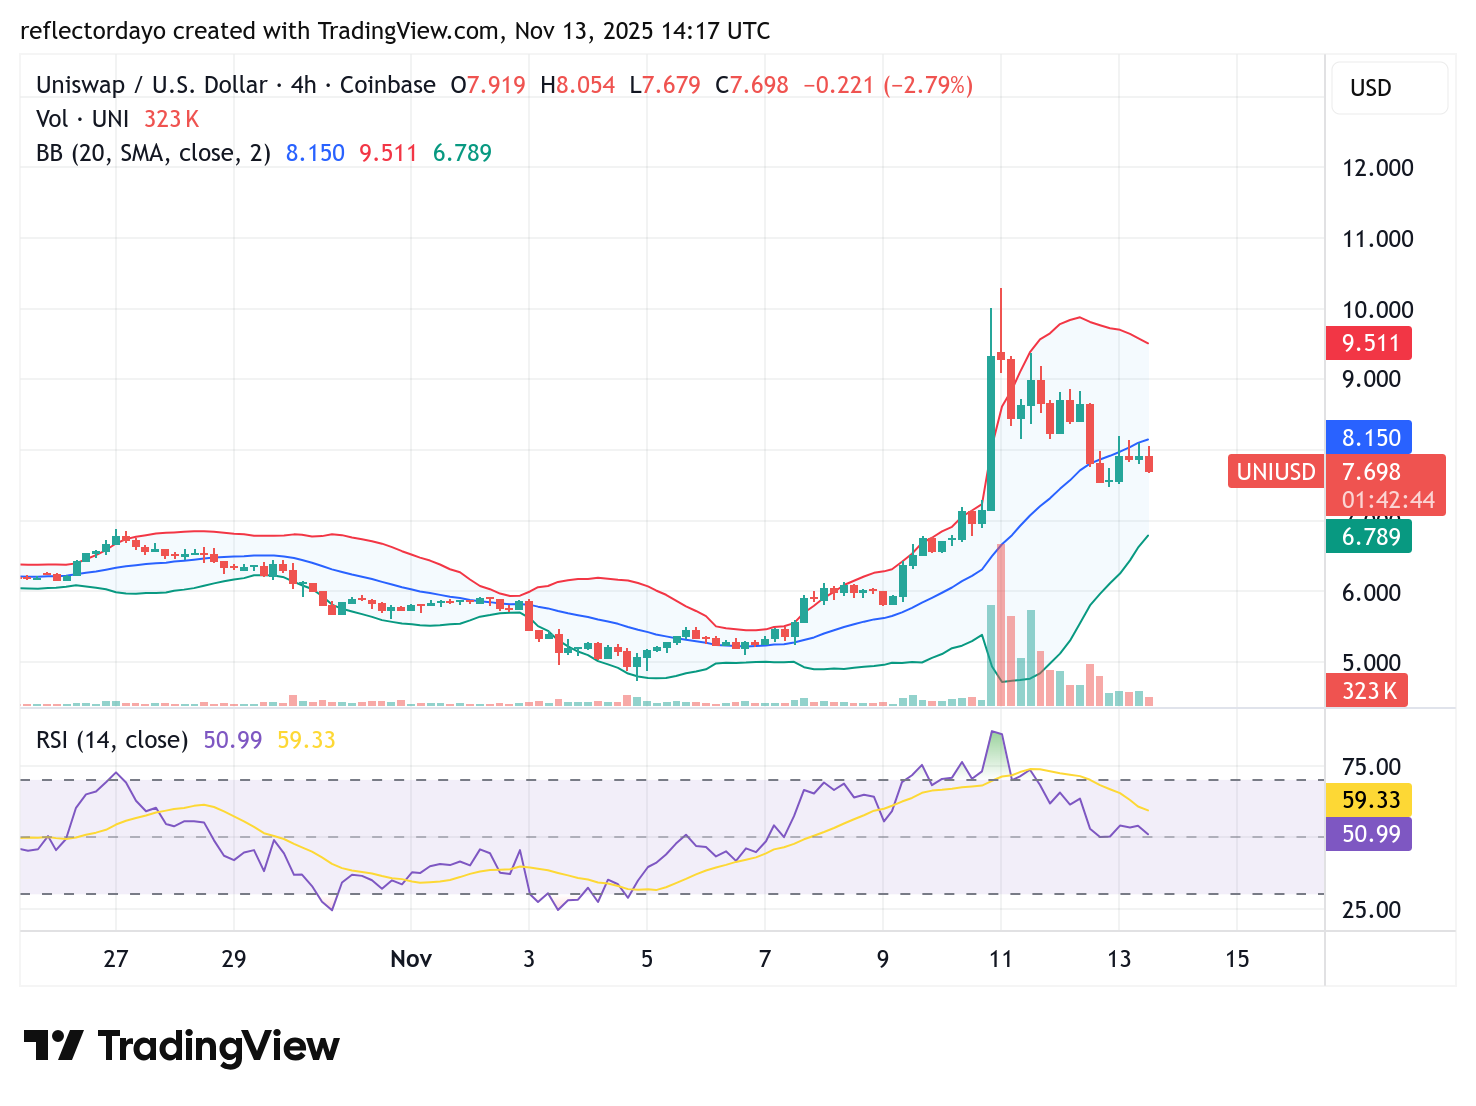
UNI/USD 4-Hour Chart Outlook
The price action on the 4-hour chart suggests a potential consolidation around the $7.50 price level. This outlook of the crypto signal is supported by the convergence of the Bollinger Bands, indicating reduced volatility and the likelihood of sideways movement. Additionally, the RSI is hovering near the 50 mark—the midpoint of the indicator—which reflects a balance between buying and selling pressures at this level.