Bitcoin Price Prediction: BTC/USDT Sticks to Moderate Gains
Estimated Reading Time: 3 minutes
Don’t invest unless you’re prepared to lose all the money you invest. This is a high-risk investment and you are unlikely to be protected if something goes wrong. Take 2 minutes to learn more

Bitcoin Price Prediction (April 1, 2025)
The Bitcoin market has breached some important psychological resistance price levels. This, in turn, suggests that market participants are becoming increasingly bullish as trading continues. Additionally, price action in this market has started rising past key technical landmarks, which may indicate continued price increases.
BTC/USDT Long-Term Trend: Bearish (Daily Chart)
Key Price Levels:
Resistance: $85,000, $90,000, $95,000
Support: $80,000, $75,000, $70,000
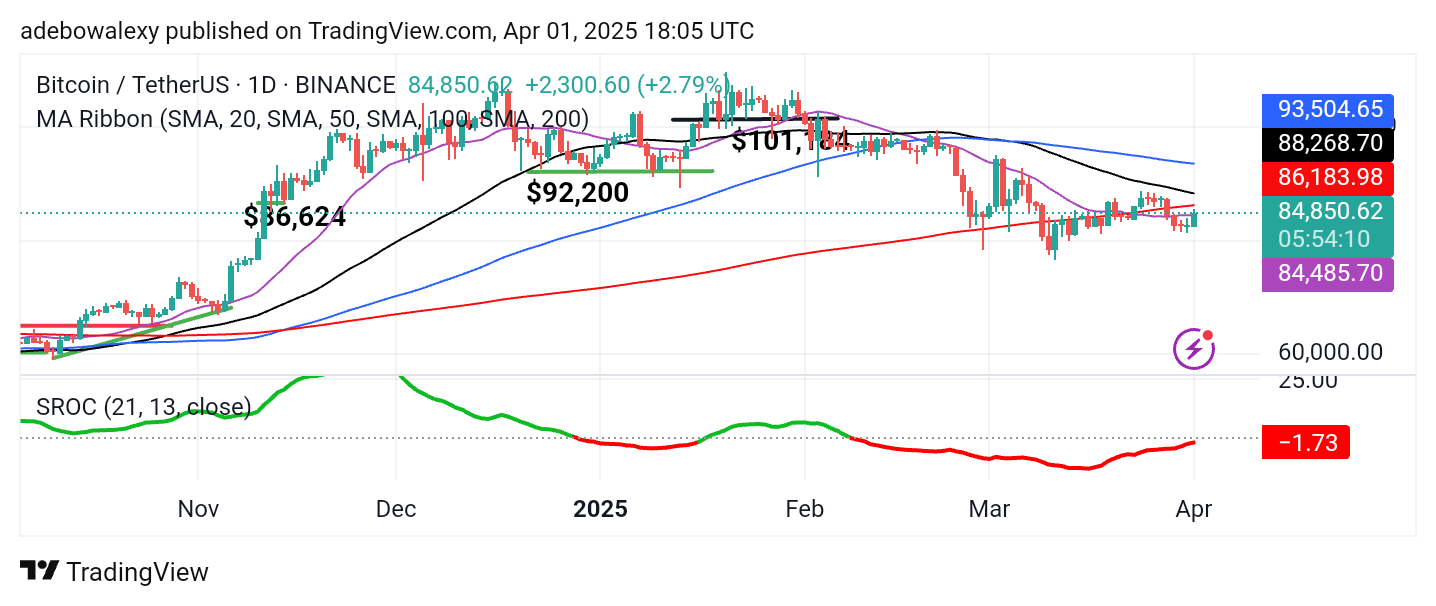
The ongoing session in the Bitcoin daily market has been able to sustain its upside retracement. Consequently, this has pushed the token’s current price above the 20-day Moving Average (MA) lines. Additionally, the corresponding price candle for the ongoing session appears green and significantly larger than that of the previous session. Furthermore, the Stochastic Rate of Change (ROC) indicator is taking an upward path toward the equilibrium level from below.
Bitcoin Price Prediction: BTC/USDT Bullish Outlook Brightens
Price activity in the Bitcoin daily market has breached the first technical resistance formed by the 20-day MA lines. The corresponding price candle also suggests growing bullish momentum in the market.
A careful observation of the latest price candle on this daily chart reveals that the $85,000 price level has been tested. Meanwhile, the Stochastic ROC indicator lines are aligning with the strengthening bullish outlook. Therefore, traders can maintain an optimistic stance in this market.
Bitcoin Price Prediction: BTC/USDT Bulls Stay Undeterred by Minimal Rejection (4-Hour Chart)
In Bitcoin’s 4-hour market, price action has been rising steadily. However, the most recent price candle appears red, indicating a bearish retracement. Nevertheless, the token’s current price remains above most of the MA lines on the chart.
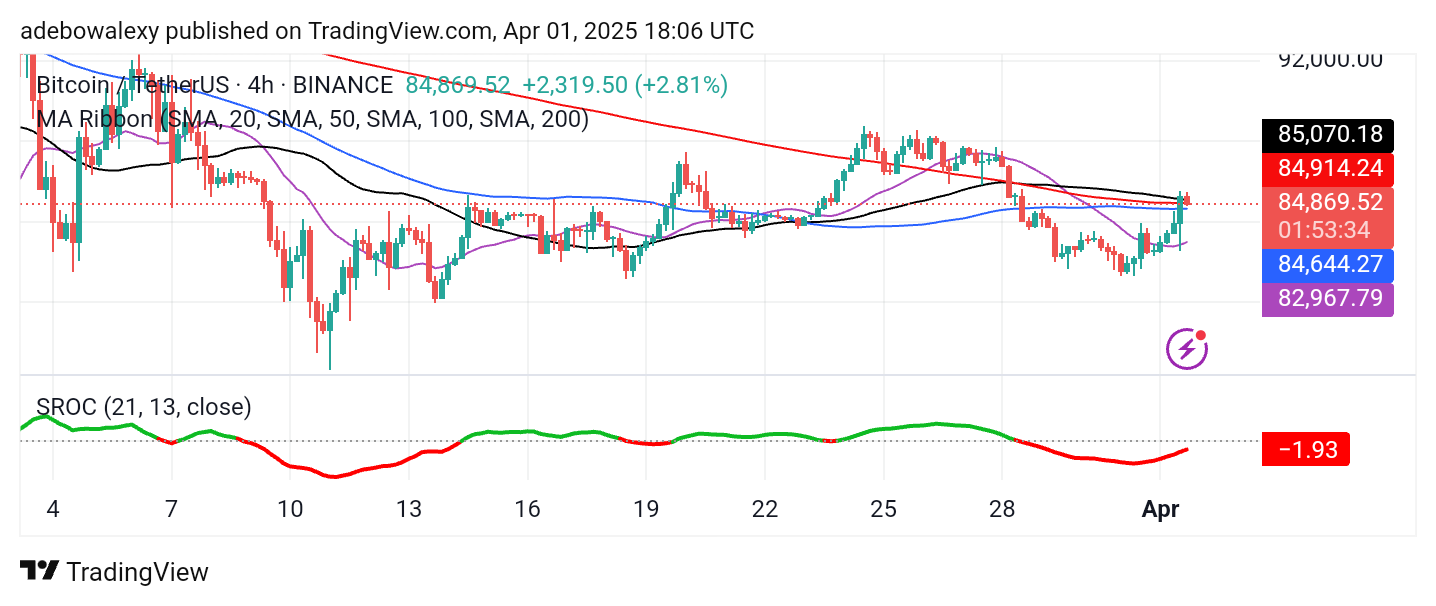
Additionally, the Stochastic ROC indicator maintains a smooth upward trajectory as it heads toward the equilibrium level. Technically, this market retains its upward momentum, as indicated by trading indicators. Given the prevailing bullish forces, traders can remain confident in targeting the $88,000 price level for short-term gains.