Litecoin Price Prediction: LTC/USDT Stays Above the $80 Price Mark
Estimated Reading Time: 2 minutes
Don’t invest unless you’re prepared to lose all the money you invest. This is a high-risk investment and you are unlikely to be protected if something goes wrong. Take 2 minutes to learn more

Litecoin Price Prediction (April 1, 2025)
The Litecoin daily market has not been able to recover significantly from the downward correction that occurred after price action last reached the $140 level. The market experienced a sharp decline and has since taken on a more subdued stance above the $80 threshold.
LTC/USDT Long-Term Trend: Bearish (Daily Chart)
Key Price Levels:
Resistance: $90, $95, $100
Support: $80, $75, $70
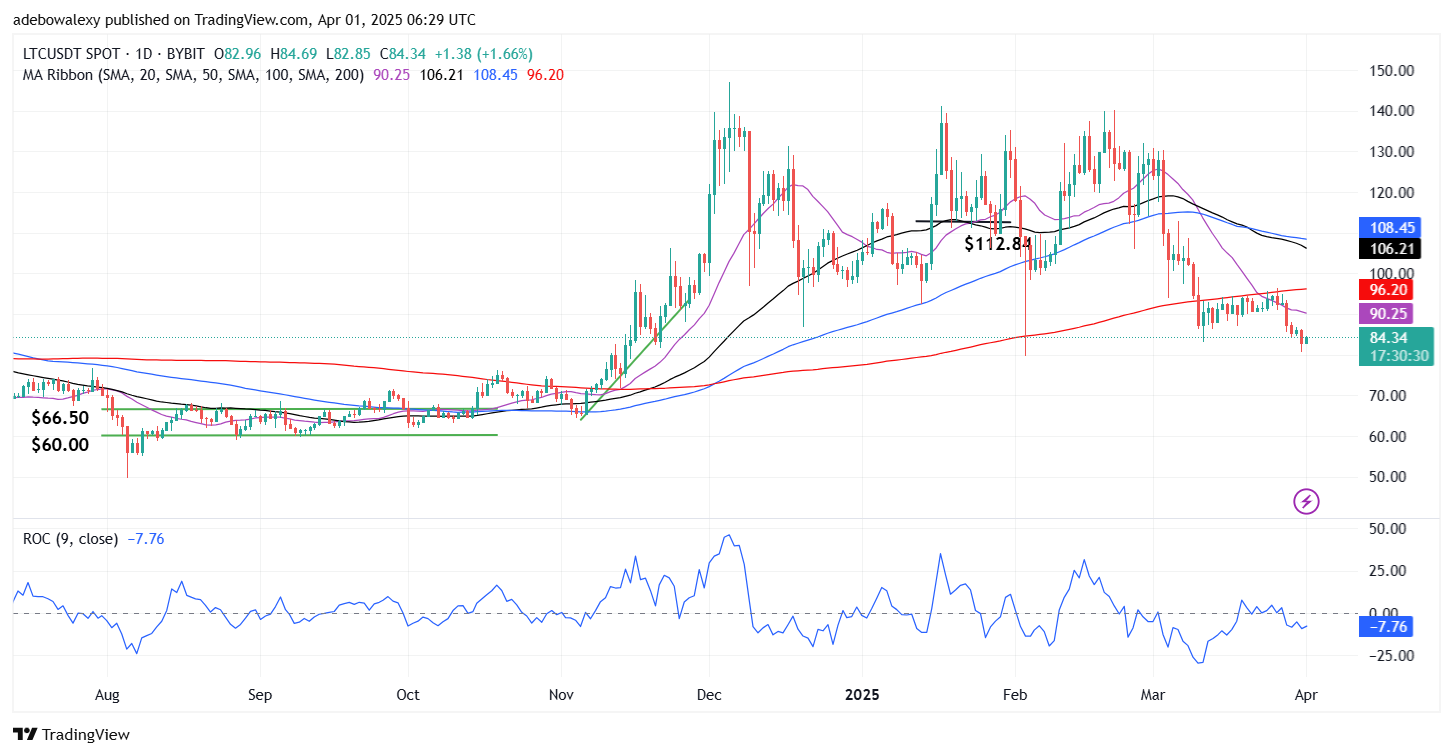
The latest price candle on this chart is bullish but has only appeared after a steep downward retracement. Nevertheless, the market remains above the $80 price level. Trading activity is also occurring below all the Moving Average (MA) lines. The Rate of Change (ROC) indicator line is below the 0.00 level. However, the terminals of this line show an upward trajectory, even while remaining below the 0.00 level of the indicator.
Litecoin Price Prediction: LTC/USDT Minimal Gains Look Subdue
As of the time of writing, the Litecoin market has seen a minimal upward retracement. However, the position of the recently formed price candle suggests that the upside retracement is facing a strong bearish sentiment. The last price candle has only appeared at the peak of a strong downward retracement.
Likewise, trading remains below all the MA lines. Be that as it may, the trajectory of the ROC indicator suggests that upward forces are gaining momentum, although they are still vulnerable at the moment.
Litecoin Price Prediction: LTC/USDT Extends Upside Gains (4-Hour Chart)
On the Litecoin 4-hour chart, we can see that the upside retracement is extending into a second consecutive session. However, these gains remain minimal and still lie below all the MA lines, even within this time frame.
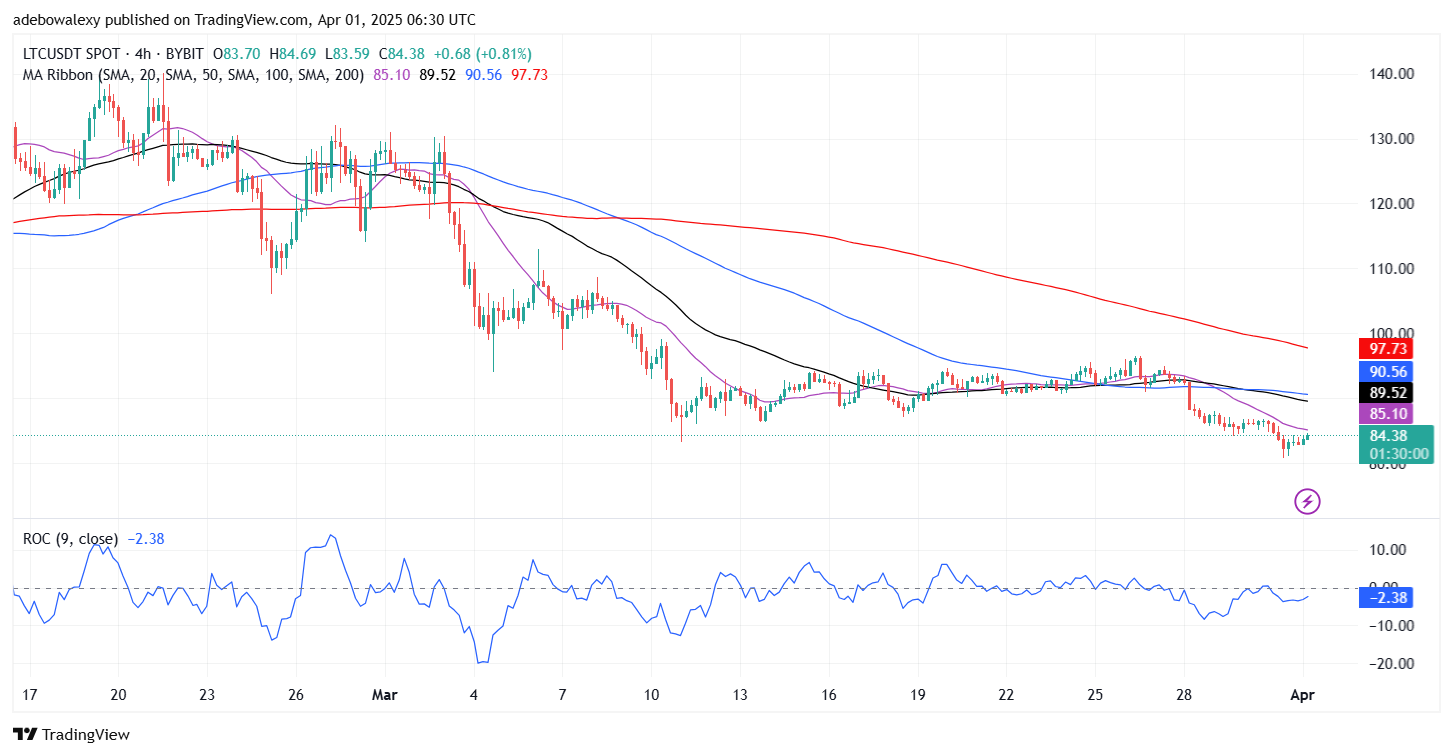
One consistent factor across both the daily and 4-hour charts is the movement of the ROC indicator. The indicator lines remain below the equilibrium level, just as they were on the daily chart. Nevertheless, the indicator’s lines maintain an upward trajectory. Consequently, the behavior of price action suggests that this token may see price increases from $85.00 toward the $90.00 price level.

