Pepe Unchained (PEPUUSD) Holds Steady at $0.0137 Amidst Reduced Volatility
Estimated Reading Time: 3 minutes
Don’t invest unless you’re prepared to lose all the money you invest. This is a high-risk investment and you are unlikely to be protected if something goes wrong. Take 2 minutes to learn more

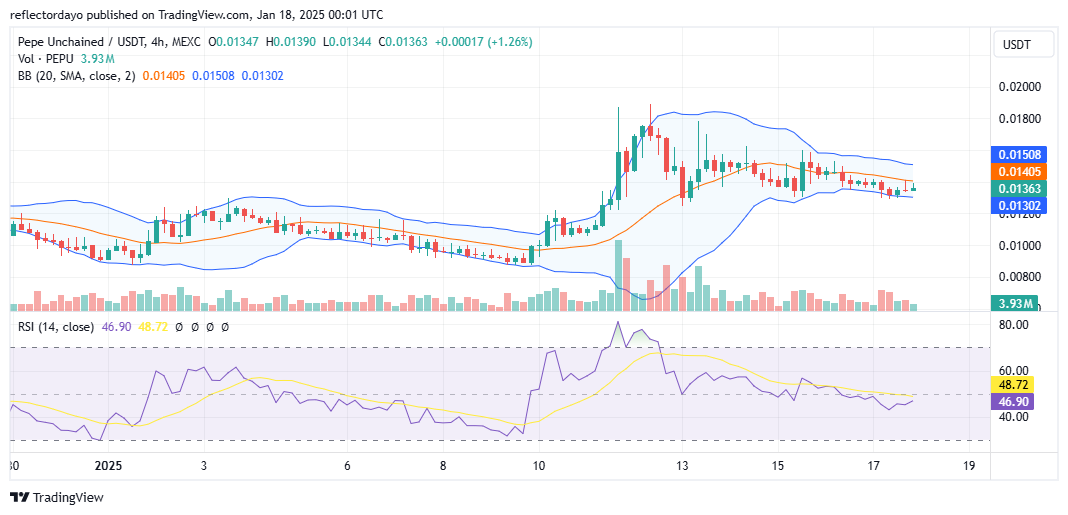
The bearish move that began at the $0.018 price level faced significant resistance as strong bullish activity emerged, causing the price to oscillate sharply between $0.013 and $0.018. Over time, the heightened market activity subsided, and Pepe Unchained (PEPUUSD) stabilized around the $0.0137 level.
This crypto signal stabilization, accompanied by a decline in market volatility, suggests that traders remain cautiously optimistic, as bearish momentum has weakened. The pullback from $0.018 found robust support near $0.013, where sustained buying pressure effectively countered the sell-off. Following an intense period of volatility, the market has entered a consolidation phase, with prices steadying around $0.0137.
Key Levels to Watch:
- Resistance: $0.016, $0.018, and $0.020
- Support: $0.015, $0.013, and $0.010
Pepe Unchained Price Analysis from an Indicator Perspective
Technical indicators point to a consolidation phase in the market, with the Bollinger Bands providing a clear illustration of declining volatility. The narrowing of the bands highlights reduced market activity, as the $0.013 level emerges as a strong support zone, offering buoyancy and potential for a rebound.
The trading volume indicator reinforces this observation, as declining histograms suggest waning PEPUUSD market participation. This likely stems from the prolonged tug-of-war during the earlier period of heightened volatility, reflecting indecision about the market’s next move.
A slight bearish bias remains, with the price positioned below the 20-day moving average. However, the resilience shown by the bulls in defending key levels hints at the possibility of a bullish breakout in the near term.
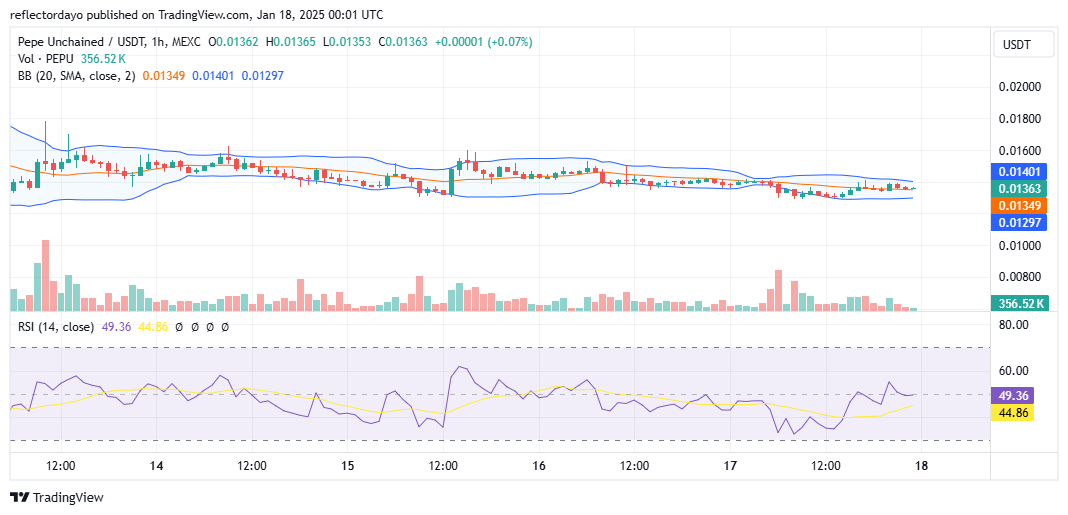
Short-Term Outlook for PEPUUSD: 1-Hour Chart
On the 1-hour chart, the market shows signs of equilibrium as indecision persists. Recent candlesticks are aligning with the 20-day moving average, indicating a balanced state between buyers and sellers. Trading volume has gradually declined, signaling a temporary lull in activity.
The Relative Strength Index (RSI) further supports this observation, with its line hovering around the midpoint, reinforcing the notion of market equilibrium. This often precedes a strong price movement, with an upward breakout appearing more likely as bulls gain control at the current price level.
Buy Pepe Unchained!
Ready to Pump? pic.twitter.com/RRnpY7srJv
— Pepe Unchained (@pepe_unchained) January 9, 2025
Buy and stake NOW on the L2 for DOUBLE staking rewards! Pepe Unchained (PEPU)