BNB (BNB/USDT) Consolidates Near Key Levels: Will Buyers Push for a Breakout or Lose Control?
Estimated Reading Time: 3 minutes
Don’t invest unless you’re prepared to lose all the money you invest. This is a high-risk investment and you are unlikely to be protected if something goes wrong. Take 2 minutes to learn more
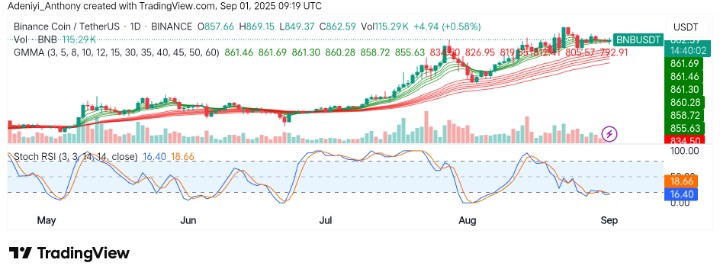
BNBUSDT Daily Analysis: Ranging
The price of BNB against Tether is currently moving sideways after weeks of steady growth. As it stands, this pause shows that both buyers and sellers are fighting for dominance. At the moment, market sentiment is cautious as buyers want to protect their gains, while sellers want lower prices.
The pair in recent times has been holding within the Guppy Multiple Moving Averages (GMMA), which shows bulls are still active. However, the price has struggled to move past resistance around the $880 zone. At the same time, the Stochastic RSI is in the oversold region, meaning the market momentum has dropped, and recent selling could lead to a bounce upward soon.
Currently, BNB trades at $862, printing over 115 thousand traded volumes for the day.
Technical Indicators
Major Resistance Levels: $869, $885, and $900
Major Support Levels: $849, $834, and $805
BNB Technical Analysis
At the moment, BNB against Tether candles has been trying to hold above the moving average cluster, signaling that buyers’ control. Also, the Guppy Multiple Moving Averages (GMMA) appears to be trending upward, which suggests the long-term momentum is still positive.
Though the Stochastic RSI operates in the oversold region, signaling momentum has gone down in recent sessions. However, the positioning of the lines is hinting at a bounce from the current position very soon, provided volume increases and buyers stay in the market.
To this end, the current setup suggests the bulls are preparing for another push if the price pushes above $869; otherwise, a breakdown below $849 may lead to a decline.
Some call it luck. I call it Elliott Wave + patience. January’s $938–$1179 BNB target is now in play.
Let’s see how price reacts here. https://t.co/wZ2vF5RXAL pic.twitter.com/kkNixfHkK8
— More Crypto Online (@Morecryptoonl) August 20, 2025
Meanwhile, @morecryptoonline has reiterated the need to hold on, suggesting more bullish gains for BNB in the near term, which was anchored on patience. It was stated in X (formerly Twitter) that BNB might move another inch closer to the moon.
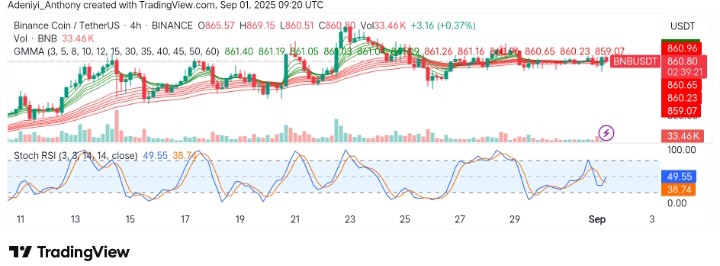
BNBUSDT Short-term Analysis: Consolidating for a Strengthened Breakout
On the 4H chart, BNB continues to move within a tight range near $860, showing reduced volatility. The GMMA averages remain compressed, signaling indecision but still tilting toward a bullish structure.
However, the Stochastic RSI is crossing upward from mid-levels, hinting at possible short-term upside momentum. On one hand, the price has repeatedly tested the $869 resistance zone, but sellers continue to reject stronger moves. On the other, support is steady around $860, showing buyers are not allowing deep pullbacks.
To this end, a break below or above the levels specified above would determine the next direction.
You can purchase crypto coins here. Buy Crypto