BNB (BNB/USDT) Sees Minor Pullback: What’s Next?
Estimated Reading Time: 4 minutes
Don’t invest unless you’re prepared to lose all the money you invest. This is a high-risk investment and you are unlikely to be protected if something goes wrong. Take 2 minutes to learn more
BNB Mid-term Analysis: Bullish
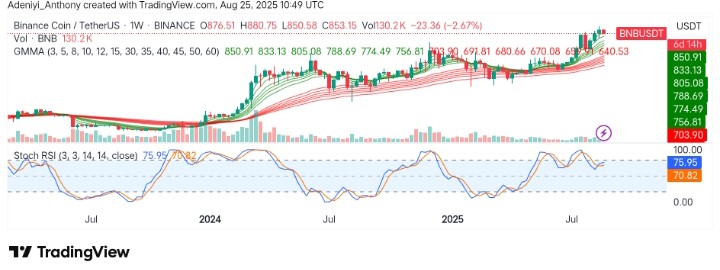
BNB against Tether has recently experienced a notable surge in momentum, creating strong bullish signals on the weekly chart. However, the market sentiment still appears positive, with a clear upward trajectory but with little decline in price.
In recent weeks, BNB has been trading in a powerful uptrend, especially visible in the surge from around $670 to its current price of $853.15. This rapid rise shows the influence of strong bullish sentiment, as price action consistently closes above previous resistance levels. As it stands, the market seems to be on a strong buy volume with potential for further movement to the upside, although caution is required due to overbought conditions indicated by technical indicators like the Stochastic RSI.
Currently, BNB trades at $853.15 with over 130 thousand traded volumes at the beginning of the week.
Technical Indicators
Major Resistance Levels: $880.75, $930.00, and $1,000
Major Support Levels: $806.09, $775.20, and $704.19
BNB Technical Analysis
Given the current trend and indicators, the market for BNB against Tether is likely to experience a brief consolidation before potentially breaking higher. The Guppy Multiple Moving Averages (GMMA) shows the pair is well positioned for further bullish actions. However, the current dip in price shows the pair may be testing immediate support for a strong base.
On the other hand, the Stochastic RSI is currently at 75.95, well into overbought territory. Though the indicator’s lines suggest minor extension into the overbought territory, a rise in bullish volume could also mean that BNB could still have some room to rise before a potential pullback.
To this end, a break above $850 would indicate bullish continuation, while a move below this level could signal further correction.
BNB/USDT Daily Analysis: Where from Here?
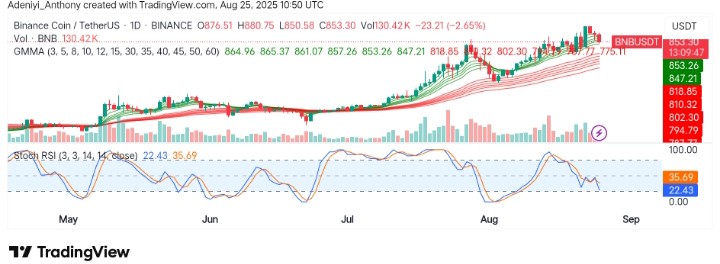
The daily chart reveals a notable pullback from the highs, with BNB/USDT currently facing resistance at $880.75. The GMMA indicators suggest that despite the overall uptrend, the short-term EMAs appear to be slowing as the price faces consolidation.
On the other hand, the Stochastic RSI at 22.43 indicates oversold conditions, suggesting a potential rebound or reversal in the near future.
As it stands, an observed decline in volume would suggest bullish momentum might be losing steam, but the structure of the GMMA indicates the buyers are still in control of the market. To this end, a reversal pattern could play out if the price can find a base around $850 level in the near term.
Meanwhile, despite the current market situation, @cryptopatel believes BNB has the potential to hit above $1,000 after hitting an all-time high in a recent trading session.
$BNB hits a new ATH at $900
Looking at historical fractals & chart structures, the question is simple:
Can $BNB join the $10,000 club in the future?Long-term vision, strong fundamentals, growing ecosystem… The setup looks massive.
What’s your take on BNB road to 5-figures?… pic.twitter.com/cnVdjTTzh5
— Crypto Patel (@CryptoPatel) August 24, 2025
You can purchase crypto coins here. Buy Crypto