Wall Street Memes (WSM) Price Rallies, Tending Correction
Estimated Reading Time: 3 minutes
Don’t invest unless you’re prepared to lose all the money you invest. This is a high-risk investment and you are unlikely to be protected if something goes wrong. Take 2 minutes to learn more

Wall Street Memes Price Prediction – February 13
The probability potency pace to keep up rising forces on a stable path further to the moon side seems to soon begin to witness a sizeable amount of weaknesses, as the WSM/USD market operation now rallies toward $0.002, tending correction in its signal inputs.
Although there have been signs of regression in the crypto economy’s valuation, the emergence of recovery forces should not be dismissed, as this price movement could provide the WSM/USD bulls with an opportunity to regain momentum for a sustained upward progression in the long term.
WSM/USD Market
Key Levels
Resistance levels: $0.002, $0.0025, $0.003
Support levels: $0.0008, $0.0006, $0.0004
WSM/USD – 4-hour Chart
The WSM/USD market 4-hour chart characterizes that the crypto-economic market, at this moment, rallies, tending correction below the $0.002 value line.
A series of 4-hour candlesticks has consistently formed along the upper Bollinger Band, signaling increasing buying momentum. However, the formation of a bearish candlestick, if it reaches the middle band, could signal a potential pullback towards lower levels. Meanwhile, the stochastic oscillators remain balanced, maintaining an upward trend around the 80 mark.
As the bullish-signal base indicated by the oscillators on the medium-term chart, is it technically advisable for WSM/USD traders to initiate additional buy positions?
Medium-term investors turning into long-term systemic basis are logically believed to benefit handsomely alongside the approaching method of leaving positions open to run for a long time beyond the buying level positively, as the WSM/USD market rallies, tending correction.
Any potential shift of the stochastic oscillators toward the downside, with or without a reversal of the current bullish outlook, would likely trigger another round of accumulation in the prior lower zones. Long-term investors should remain patient, as rebounds could materialize with renewed upward momentum in the near future.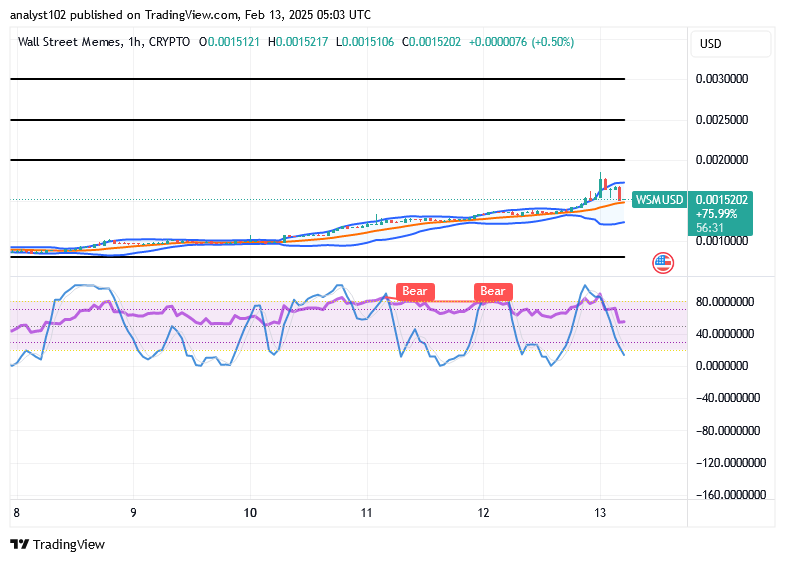
WSM/USD 1-hour chart
The 1-hour chart from the technical settings of the short-term setup shows that the WSM/USD trade currently rallies, tending to correct in its inputs.
The Bollinger Bands’ trend lines suggest a potential series of reversals beneath the $0.002 mark. The stochastic oscillators are showing a southward bias after failing to sustain consolidation in the overbought region. However, the overall projection indicates that buying pressure is likely to persist, driving prices higher beyond the current market level in the long term.
Would it be a good move for Musk to acquire OpenAI?
Should Musk buy OpenAI? https://t.co/jEhYaVBI8A
— Wall Street Memes (@wallstmemes) February 13, 2025
Buy and stake WSM now!: Wall Street Meme (WSM)