Wall Street Memes (WSM) Price Eyes $0.0015, Aiming Reverses
Estimated Reading Time: 3 minutes
Don’t invest unless you’re prepared to lose all the money you invest. This is a high-risk investment and you are unlikely to be protected if something goes wrong. Take 2 minutes to learn more
Wall Street Memes Price Prediction – February 12
As of the time of this write-up, based on the pricing formulation settings of the medium-term technical outlook, lower highs are seen dominating the pushing pace up to a considerable increase point, as the current economic situation of the WSM/USD market shows that the price now eyes $0.0015, aiming for a reversal.
In line with that sentiment, the crypto market may experience brief consolidations and modest pullbacks, aimed at building momentum for a higher rally, potentially leading to significant gains. Long-term investors are advised to maintain their existing positions, as the projected rebound cycle remains intact and poised for future upward movement.
WSM/USD Market
Key Levels
Resistance levels: $0.0015, $0.002, $0.0025
Support levels: $0.00075, $0.0005, $0.00025
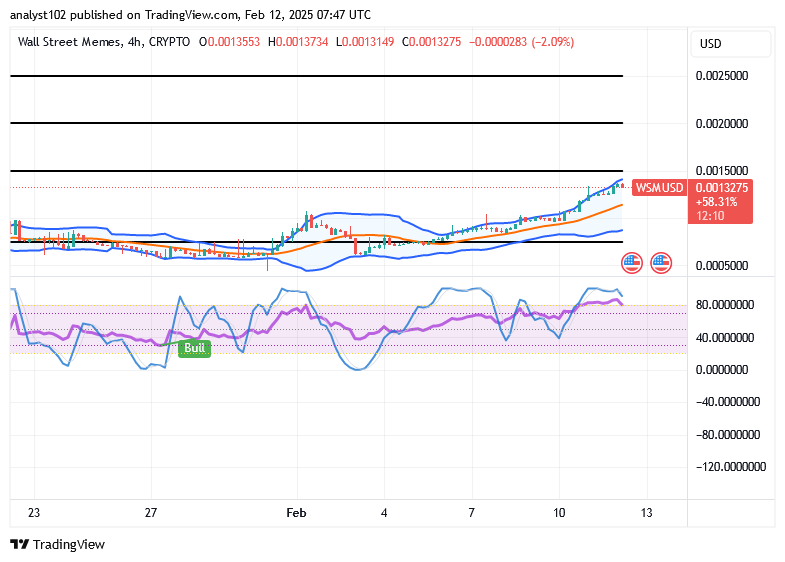
WSM/USD – 4-hour Chart
The WSM/USD market 4-hour chart indicates that the crypto-economic market eyes $0.0015, aiming for a reversal.
A small 4-hour bearish candlestick is forming near the upper Bollinger Band, with the market trading around $0.0013275. The stochastic oscillators have entered the overbought zone, signaling a potential downside reversal within the current trend.
Given the oscillators’ positioning in the overbought zone, is it strategically prudent for traders to begin exiting the WSM/USD position as it approaches $0.0015?
Long-term investors or traders are not logically expected to start quitting position orders at this point; instead, they need to add up more points because the base instrument is yet underpriced, as the WSM/USD market eyes $0.0015, aiming for a reversal input.
If the current reversal intensifies and reaches the middle Bollinger Band, subsequent price action could form lower lows, potentially testing the lower band. This could set the stage for fresh long entries at more favorable price levels. In conclusion, exiting the market prematurely may result in missing the opportunity to accumulate at lower prices before a significant rally.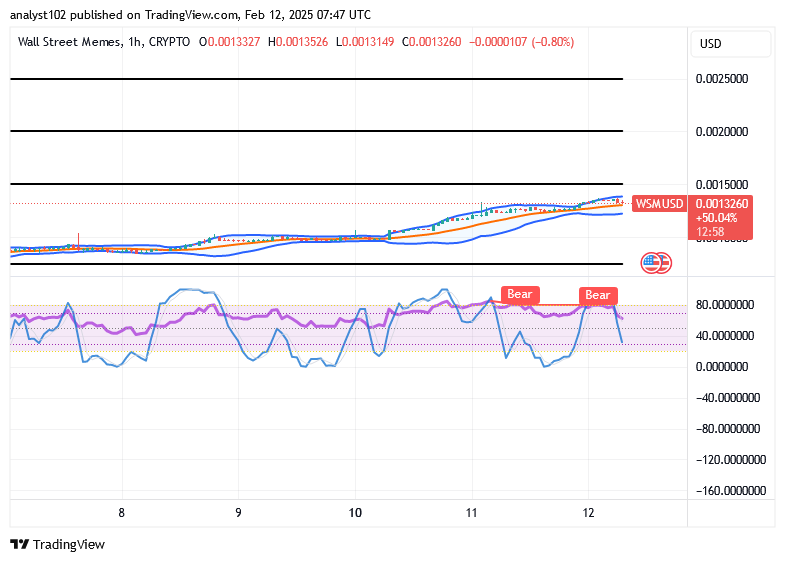
WSM/USD 1-hour chart
The 1-hour chart from the technical point of the short-term setup showcases that the WSM/USD market eyes $0.0015, aiming for a reversal in the signal setting.
Over the past few hours, the stochastic oscillators on the hourly chart have signaled two bearish events, approaching the 20 line to the downside. Meanwhile, the Bollinger Bands trend lines remain positioned upwards near the $0.0015 level, indicating an ongoing recovery phase. This suggests that buyers could potentially capitalize on a move higher once the pullback completes.
Football fans across the nation were left puzzled and alarmed to realize that, once again, no bowl was featured during the Super Bowl.
Bowl fans nationwide were confused and frightened to discover that once again no bowl was featured during the Super Bowl. https://t.co/21sg4Gvc2G
— Wall Street Memes (@wallstmemes) February 12, 2025
Buy and stake WSM now!: Wall Street Meme (WSM)

