Binance Coin Declines as It Revisits the Previous Low at $281
Estimated Reading Time: 2 minutes
Don’t invest unless you’re prepared to lose all the money you invest. This is a high-risk investment and you are unlikely to be protected if something goes wrong. Take 2 minutes to learn more
Binance Coin (BNB) Long-Term Analysis: Bearish
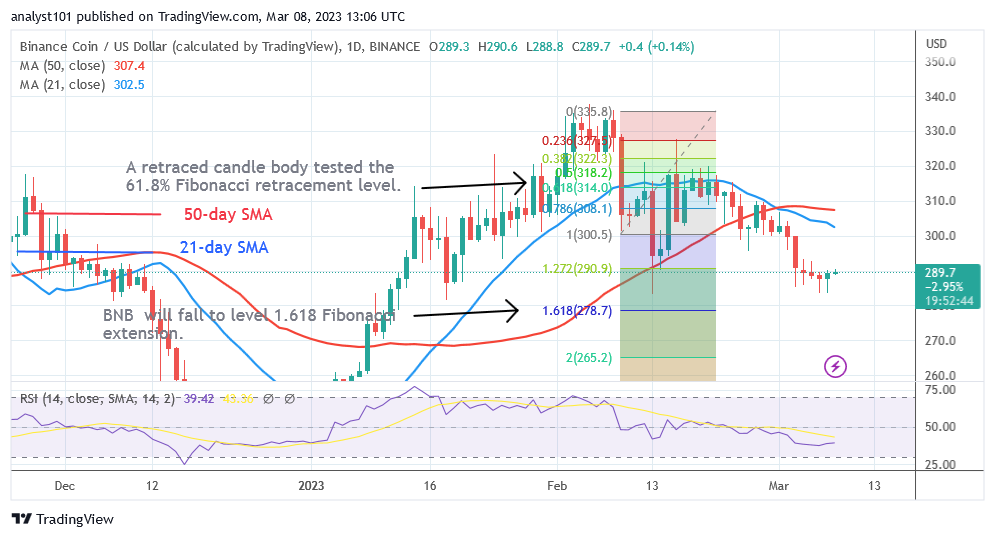
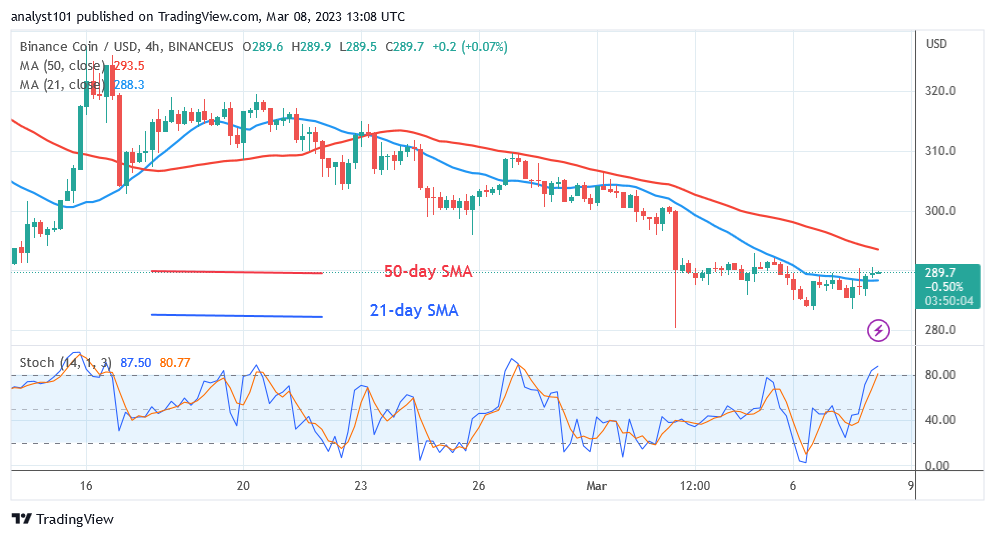
Binance Coin (BNB) bearish trend has subsided as it revisits the previous low at $281. BNB resumes consolidation after holding above the current support level. With the appearance of Doji candlesticks, the bearish trend has subsided. On March 3, the cryptocurrency asset returned to its historical price level of $285.40. For the past two months, buyers have been defending the current support. If the current support holds, the upward trend will resume. Meanwhile, the price indicator has indicated that the cryptocurrency will continue to fall. BNB made an upward correction on February 9 downtrend and a retraced candle body tested the 61.8% Fibonacci retracement level. According to the correction, BNB will fall to the 1.618 Fibonacci extension level, or $278.70.
Binance Coin (BNB) Indicator Analysis
BNB is in the bearish trend zone and trading at level 38 of the Relative Strength Index level for period 14. BNB is getting close to the market’s oversold region. The cryptocurrency’s price bars are below the moving average lines, which suggests a likely decline. The altcoin’s daily Stochastic is above level 80. The coin may begin to decline as it gets closer to the overbought region of the market.
Technical indicators:
Major Resistance Levels – $440, $460, $480
Major Support Levels – $240, $220, $200
What Is the Next Direction for Binance Coin (BNB)?
Binance Coin is trading above the $280 support level as it revisits the previous low at $281. Since January 18, the coin has been able to keep its price above $280. It is currently moving in a bearish direction and returning to the previous low at $284.
You can purchase crypto coins here. Buy LBLOCK
Note: Cryptosignals.org is not a financial advisor. Do your research before investing your funds in any financial asset or presented product or event. We are not responsible for your investing results