Uniswap (UNI) Price Prediction: UNI/USDT Hopes to Shake Off Bearish Sentiments
Estimated Reading Time: 2 minutes
Don’t invest unless you’re prepared to lose all the money you invest. This is a high-risk investment and you are unlikely to be protected if something goes wrong. Take 2 minutes to learn more

Date: November 13, 2025
The Uniswap market has witnessed a sharp upward rebound over the past week. Although the last two sessions have produced some downward retracement, bullish momentum appears to be returning, causing price action to rebound upward.
UNI/USDT Long-Term Trend — Bearish (Daily Chart)
Key Price Levels
Resistance: $9.00, $10.00, $11.00
Support: $8.00, $7.50, $6.00
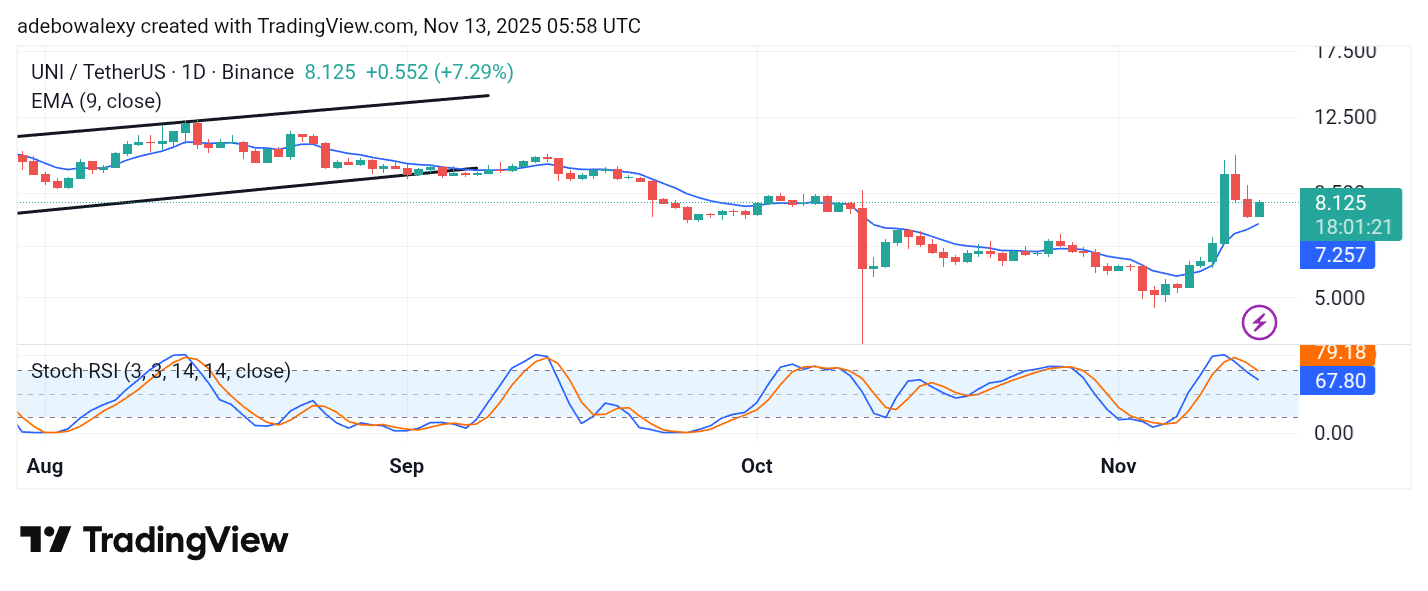
The Uniswap market on the daily chart has seen a notable upward bounce during the ongoing session. This move has kept the market from falling below or testing the 9-day Exponential Moving Average (EMA) line. Meanwhile, the lines of the Stochastic Relative Strength Index (SRSI) indicator remain on a downward trajectory, having fallen below the 80 mark.
Uniswap Price Prediction: UNI/USDT May Extend Upward Rebound
The downward retracement in Uniswap was quite sharp and occurred over two sessions. However, before it took place, price action had already risen significantly above the 9-day EMA curve.
The ongoing session suggests that the upward correction, which started six sessions ago, may continue, as the corresponding price candle has appeared above the 9-day EMA.
The SRSI, however, still reflects the recent retracement, maintaining a downward slope. Nevertheless, from a technical standpoint, price action remains likely to extend its upward movement.
Uniswap Price Prediction: UNI/USDT Upside Bounce Stays Consistent (4-Hour Chart)
On the 4-hour chart, the Uniswap market shows price action consistent with upward movement.
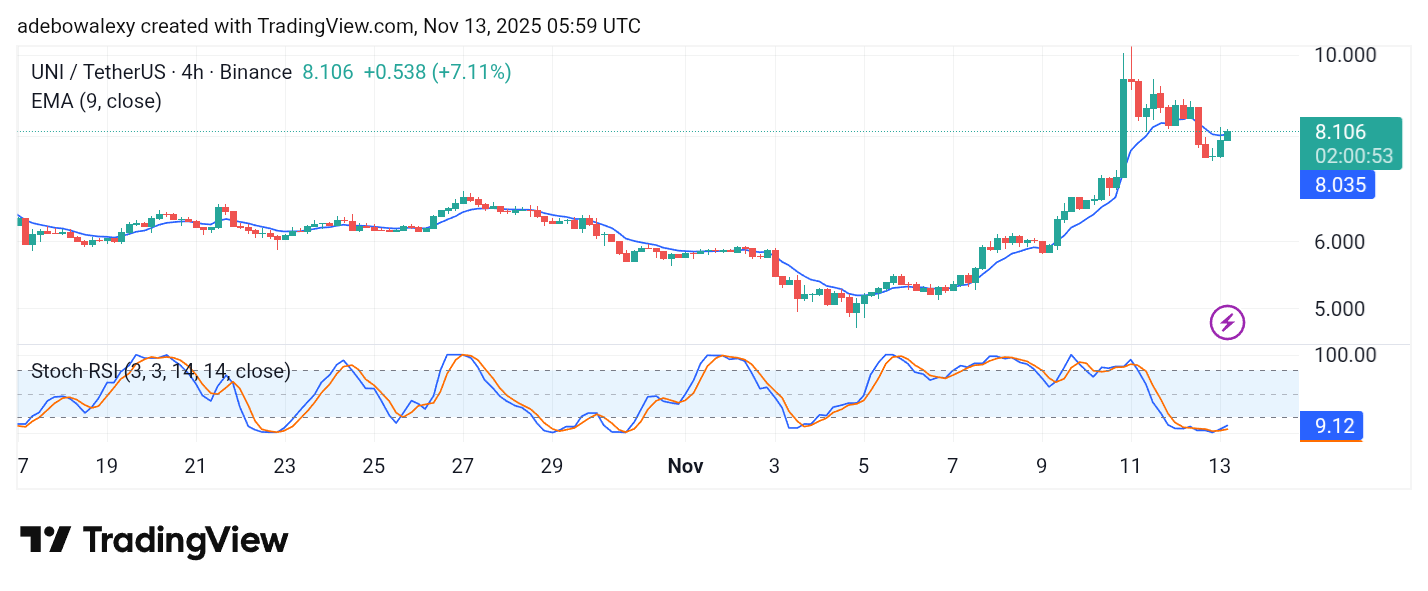
It is evident that price action has remained in the green for the past two sessions. The current session’s corresponding price candle also pokes through the 9-day EMA.
As such, trading activity on both the 4-hour and daily charts is occurring above the 9-day EMA. The SRSI indicator lines are rising from the oversold region, suggesting that bullish forces are gaining strength and that price may rise toward the $10.00 mark over subsequent sessions.