SPONGE/USD ($SPONGE) Market Insight: Buyers Hold Ground as Support Strengthens Around $0.000104
Estimated Reading Time: 3 minutes
Don’t invest unless you’re prepared to lose all the money you invest. This is a high-risk investment and you are unlikely to be protected if something goes wrong. Take 2 minutes to learn more

After pulling back from the recent high near the $0.00011 resistance area, the $SPONGE market has found renewed stability around the $0.000104 price zone. This level, now forming a key support base, underscores growing bullish resilience and signals that the market could be gearing up for its next upward phase.
Despite appearing modest, the shift to a slightly higher support level holds technical significance. It reflects a steady buildup of buying interest and confidence among market participants. The pattern of maintaining higher lows is often indicative of a market under quiet accumulation, setting the stage for a possible bullish continuation.
Key Technical Zones to Watch
- Resistance Levels: $0.000115, $0.000120, $0.000130
- Support Levels: $0.000090, $0.000085, $0.000080

SPONGE/USD Daily Chart Perspective: Buyers Establish Technical Foothold
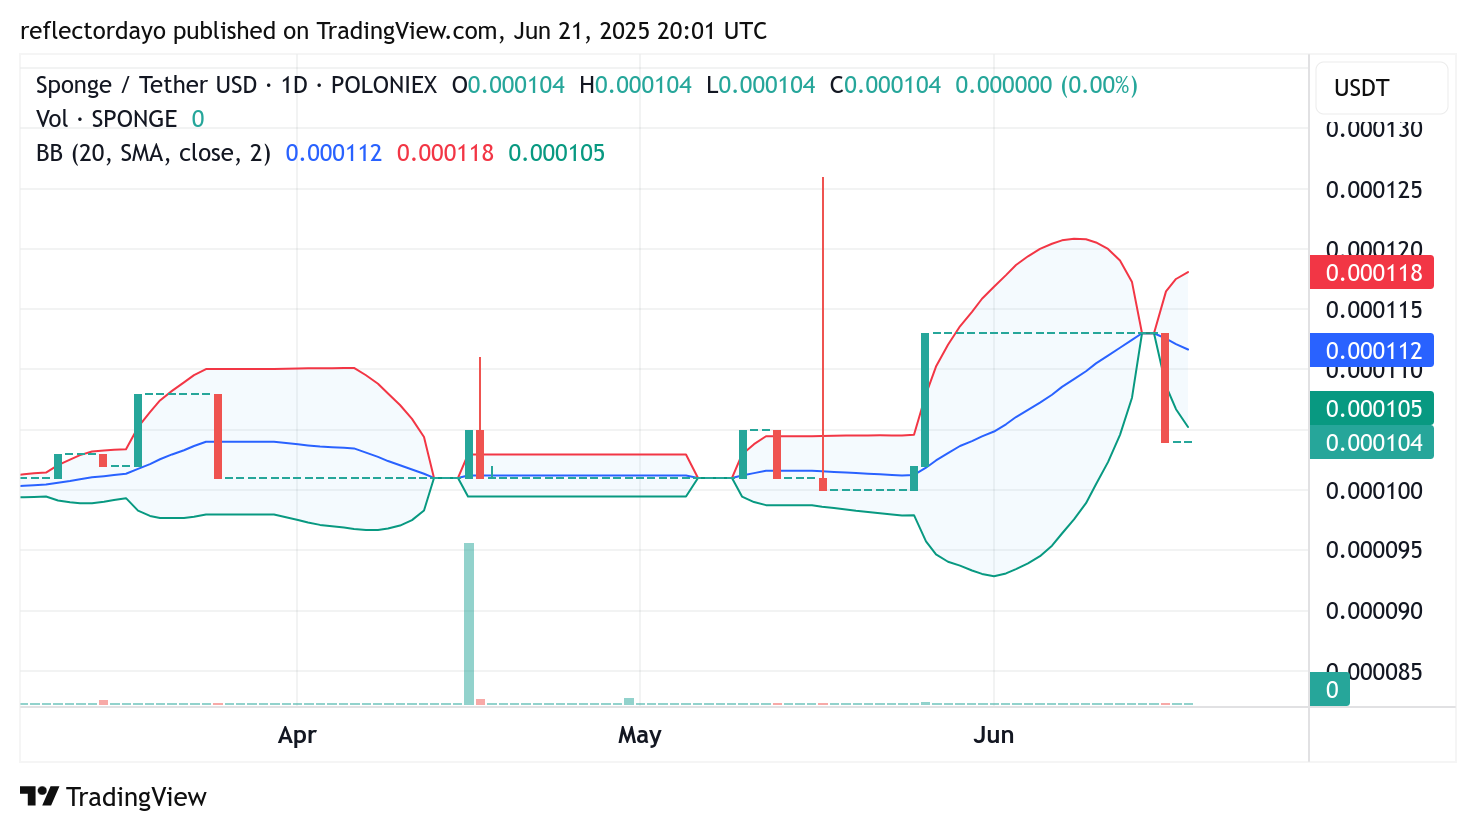
From a daily chart standpoint, $SPONGE is beginning to establish a firmer technical structure. After its corrective move from $0.00011, the pair has successfully defended the $0.000104 region, creating a new higher low—a constructive sign in favor of bulls.
Momentum indicators are gradually shifting in the bulls’ favor, even as overall trading volume remains moderate. The ability of the crypto signal to hold ground at $0.000104 suggests accumulation is underway, and a strong defense of this level may open the path toward an advance to $0.000115 and possibly even $0.00013, should buying momentum intensify.
This area also carries psychological importance, acting not just as a price floor but also as a sentiment anchor for bullish traders. Holding above it helps reinforce confidence and encourages continued positioning in favor of an upward breakout.
$SPONGE 4-Hour Chart Snapshot: Volatility Squeeze Signals Pending Breakout
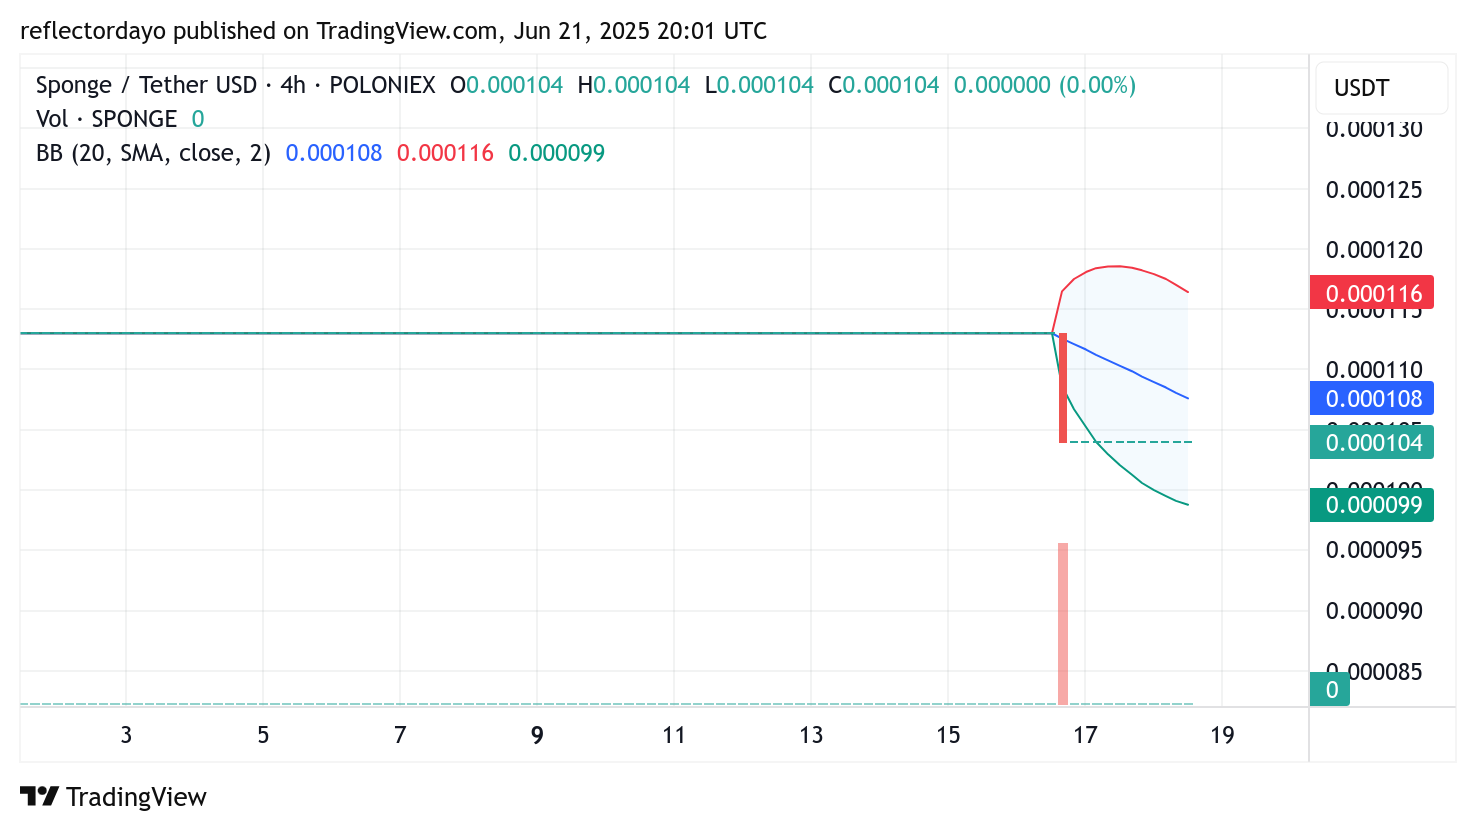
Zooming into the 4-hour timeframe, $SPONGE is currently trading within narrowing Bollinger Bands, indicating suppressed volatility. This price compression often serves as a prelude to a significant directional breakout.
Price action remains clustered near the $0.000104 support zone, and the ongoing consolidation suggests that the market is preparing for a decisive move. Given recent market behavior—characterized by higher lows and bullish rebounds—the directional bias leans upward. If a breakout is accompanied by an uptick in volume, it could confirm the beginning of the next bullish wave.
SPONGE/USD appears to be in a strategic consolidation phase, with technical signals favoring a potential upside breakout. The consistent defense of the $0.000104 support zone, combined with tightening volatility, puts the bulls in a favorable position. Traders may want to watch closely for renewed momentum and a break above short-term resistance levels, which could validate the next leg higher in this emerging uptrend.
Buy SPONGE/USD
That feeling when you blow another account. IKYK. 💦 pic.twitter.com/PlsEkis7qx
— $SPONGE (@spongeoneth) June 13, 2025
Join the SPONGE community and get in on the next big crypto opportunity! Buy Sponge ($SPONGE) today