Uniswap (UNI) Price Prediction: UNI/USDT Eyes Lower Grounds
Estimated Reading Time: 3 minutes
Don’t invest unless you’re prepared to lose all the money you invest. This is a high-risk investment and you are unlikely to be protected if something goes wrong. Take 2 minutes to learn more

Date: November 6, 2025
The Uniswap market has continued descending toward lower price levels ever since its price action peaked at the $12 mark in August. This sustained bearish movement has brought the token to trade below key technical levels, which may further strengthen bearish sentiment.
UNI/USDT Long-Term Trend — Bearish (Daily Chart)
Key Price Levels
Resistance: $6.00, $7.00, $8.00
Support: $5.00, $4.50, $4.00
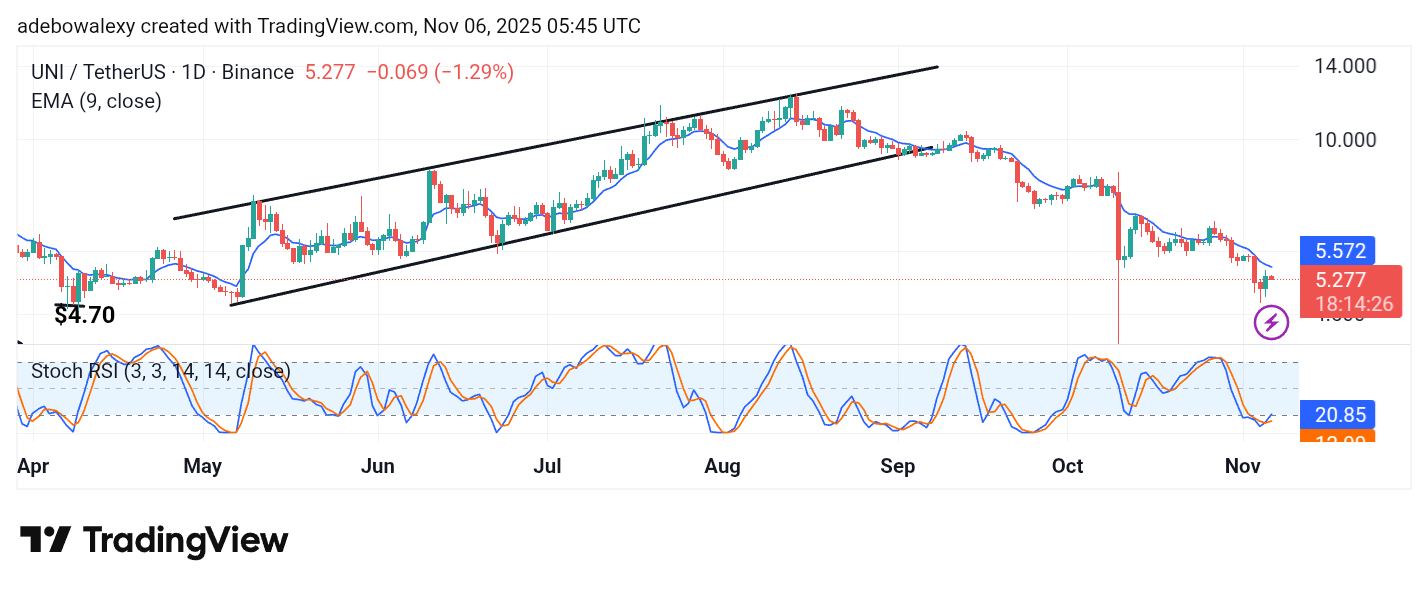
Price movement on the Uniswap daily chart remains below the 9-day Exponential Moving Average (EMA). Over the past few sessions, the market has seen some upward retracement; however, this move has not been strong enough to push the price above the 9-day EMA curve. In fact, the ongoing session has appeared as a red candle on the chart. Meanwhile, the Stochastic Relative Strength Index (SRSI) indicator lines are maintaining an upward trajectory but remain deep within the oversold region, suggesting weak bullish momentum.
Uniswap Price Prediction: UNI/USDT Market Stays in Bearish Territory
The Uniswap daily market suggests that the token may not yet be ready for a significant upside recovery. The market only experienced minor retracement in the previous session, while the ongoing session has produced a modest bearish reversal.
This price behavior keeps the market below the 9-day EMA line. Although the SRSI indicator lines maintain an upward trajectory, they remain deep in the oversold region. Therefore, this market may not experience substantial upward progress as bearish headwinds continue to dominate.
Uniswap Price Prediction: UNI/USDT Market Tilts Toward Deeper Bearish Sentiment (4-Hour Chart)
Even on the Uniswap 4-hour chart, it is evident that downward forces are gaining traction. The last price candle has breached the support formed by the 9-day EMA curve, suggesting that price action may be set for a steeper decline.
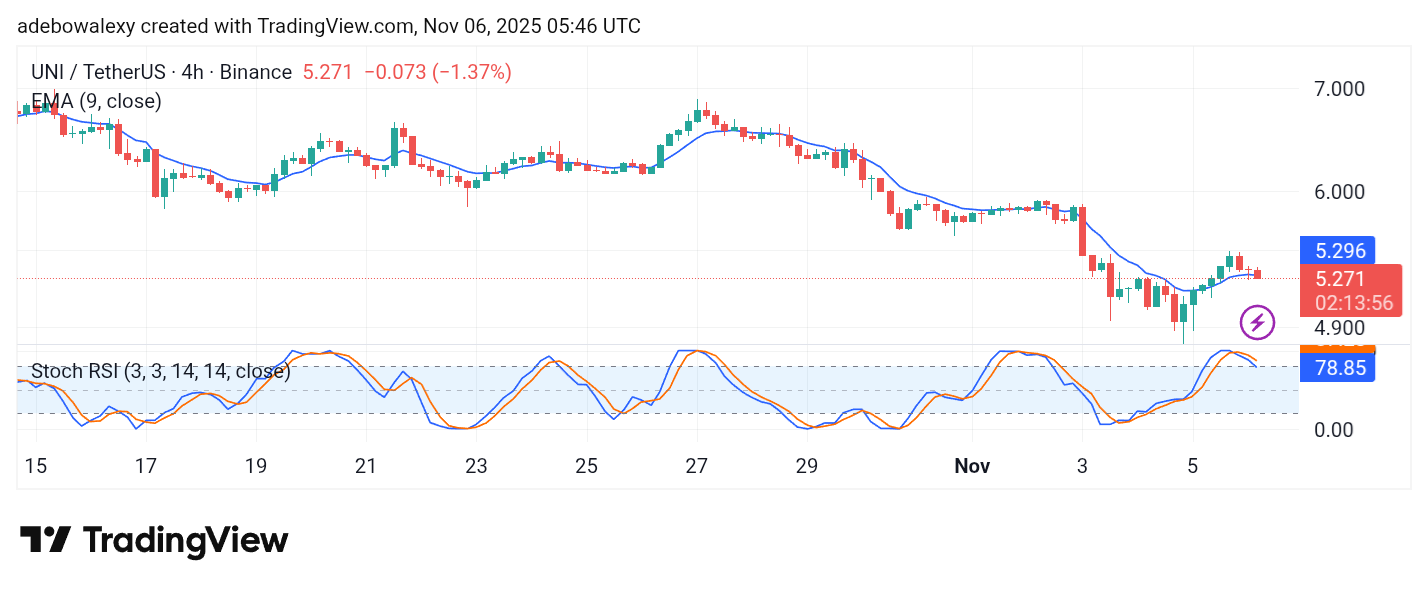
The lines of the applied SRSI indicator have taken a downward curve after peaking in the overbought region. The terminal part of the indicator continues to descend toward the 80 mark, indicating growing bearish pressure. Consequently, traders may aim for the $4.75 price level as the next potential target.