Uniswap (UNI) Price Prediction: UNI/USDT May Breach the $6 Support
Estimated Reading Time: 2 minutes
Don’t invest unless you’re prepared to lose all the money you invest. This is a high-risk investment and you are unlikely to be protected if something goes wrong. Take 2 minutes to learn more

Date: October 30, 2025
The Uniswap market has been slowly descending to lower price levels. The price decline in this market began around mid-August when price activity hit the $12 level. Since then, the market has maintained a steady downward trajectory.
UNI/USDT Long-Term Trend — Bearish (Daily Chart)
Key Price Levels
Resistance: $6.50, $7.50, $8.50
Support: $6.00, $5.00, $4.00
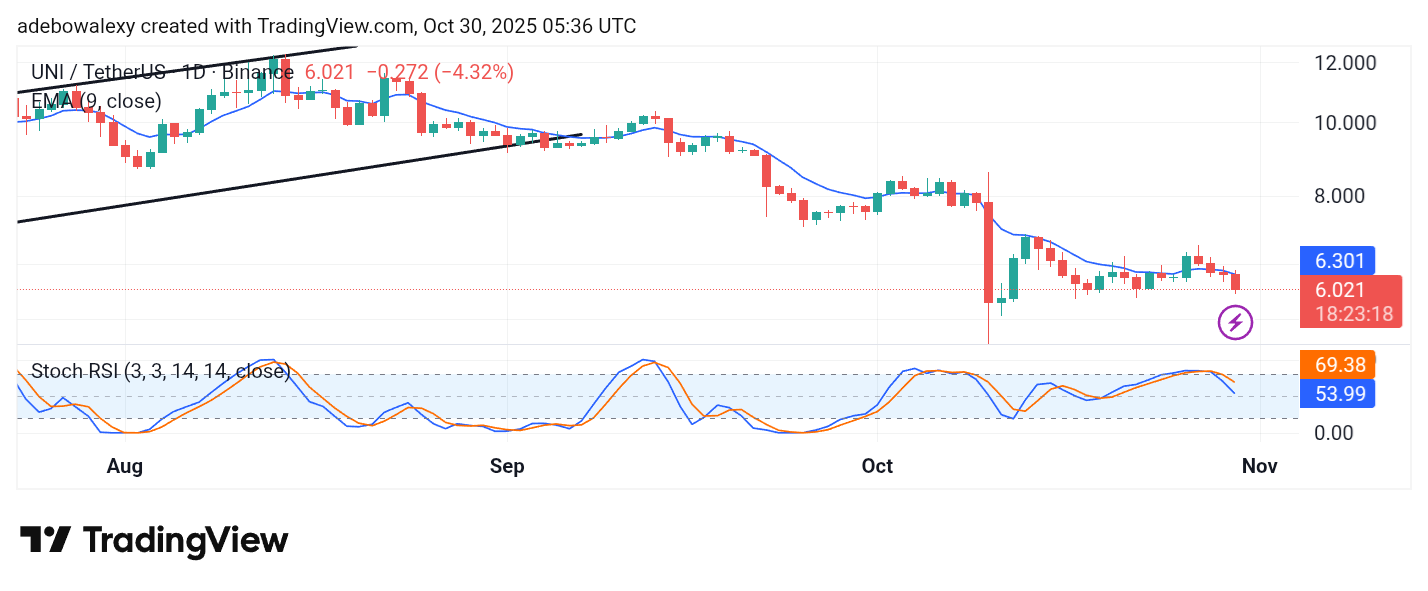
The Uniswap market continues to edge lower through the ongoing session. The last price candle on the token’s daily chart appears quite prominent and red, sitting below the 9-day Exponential Moving Average (EMA) curve. Similarly, the Stochastic Relative Strength Index (SRSI) indicator lines show a smooth downward arc following a crossover just above the 80 mark of the indicator.
Uniswap Price Prediction: UNI/USDT Nears Breaching the $6 Support
The ongoing session remains consistent with the medium-term downward trajectory. The last price candle here is clearly bearish, and its position below this key technical landmark suggests that downward forces are firmly in control.
The trajectory of the SRSI indicator also indicates that the market may continue heading further south. Consequently, with the lead SRSI line now below the 60 threshold, this market seems poised for additional price declines in subsequent sessions.
Uniswap Price Prediction: UNI/USDT Strongly Inclined Toward Further Price Declines (4-Hour Chart)
In the 4-hour Uniswap market, bearish activity appears more pronounced. The last three price candles are red and continue to move toward lower support levels. The ongoing session seems to have already tested the $6 baseline.
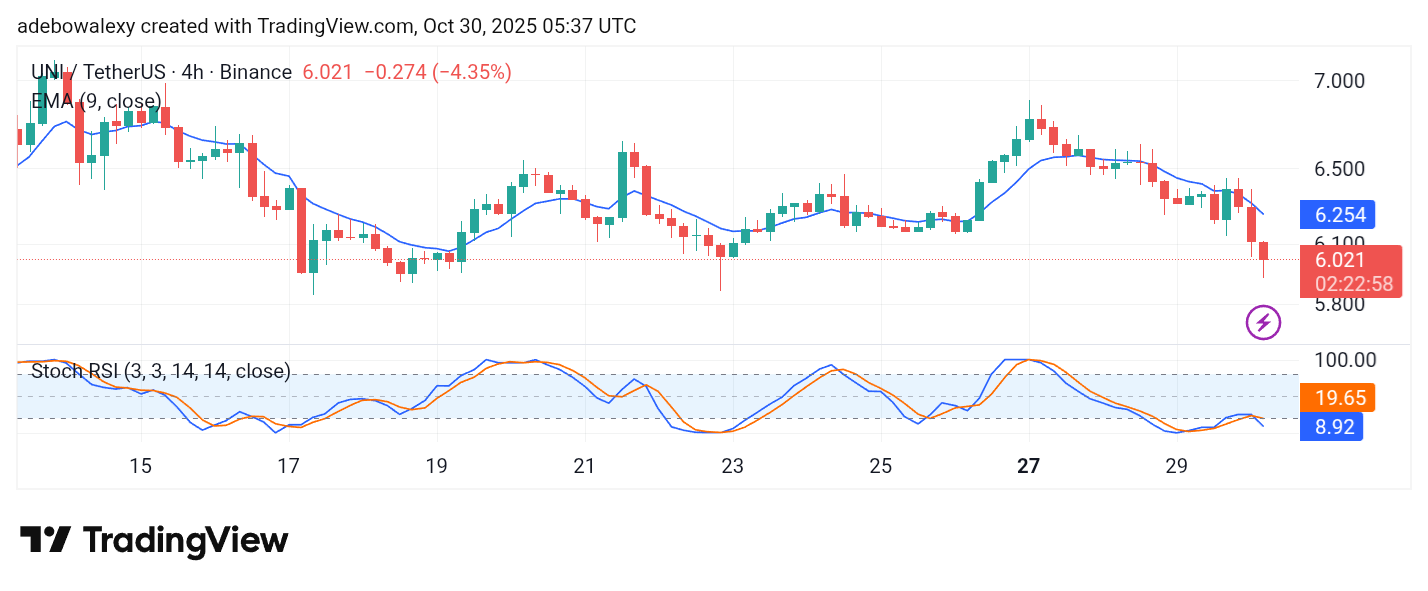
However, despite being positioned below the 9-day EMA curve, an upward contraction occurred during the session, pushing prices slightly higher. Additionally, the SRSI indicator recently delivered a downward crossover around the 20 mark, with the ensuing lines descending further into the oversold zone. As such, this market may fall toward the $5.50 price level in subsequent sessions.