Uniswap (UNI) Price Prediction: UNI/USDT Continues to Stays Low
Estimated Reading Time: 3 minutes
Don’t invest unless you’re prepared to lose all the money you invest. This is a high-risk investment and you are unlikely to be protected if something goes wrong. Take 2 minutes to learn more

Date: October 23, 2025
The Uniswap market has remained subdued, and even though the coin was able to record minimal gains, price action has continued to trade below important technical levels. This indicates that bearish forces are still likely to make further progress in the market.
UNI/USDT Long-Term Trend — Bullish (Daily Chart)
Key Price Levels
Resistance: $7.00, $8.00, $9.00
Support: $6.00, $5.50, $5.00
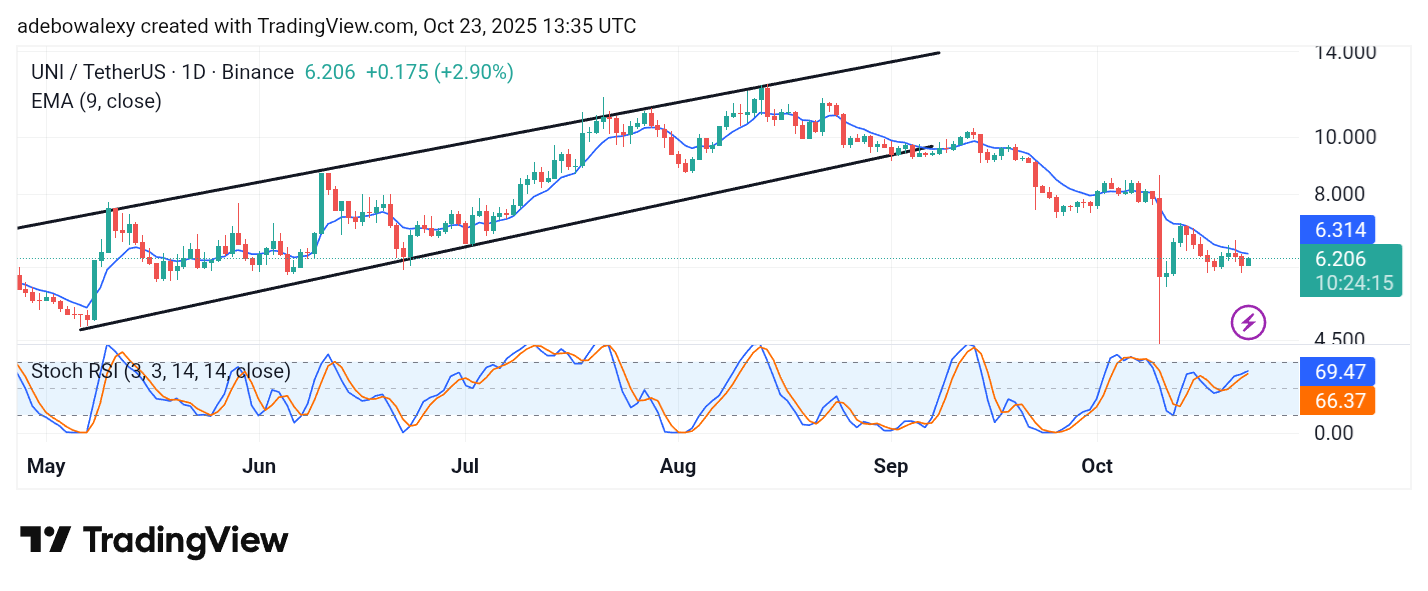
Over the past thirteen sessions, the Uniswap market has corrected significantly. Since then, price action has remained below the 9-day Exponential Moving Average (EMA) curve. However, the ongoing session has stayed green and is currently positioned close to, but still below, the 9-day EMA. Meanwhile, the Stochastic Relative Strength Index (SRSI) indicator lines have risen past the 50 level and are now approaching the 70 threshold, indicating strengthening bullish momentum.
Uniswap Price Prediction: UNI/USDT Bullish Sentiment Looks Shaky
Although the Uniswap market has seen some gains, price action has largely remained subdued. This suggests that bearish forces still have the upper hand. The most recent price candle is green but remains below the 9-day EMA curve.
Additionally, the lines of the SRSI have risen near the 70 mark, which technically suggests that bullish forces may gain more traction but are still under heavy bearish pressure. Nevertheless, bullish momentum could strengthen once price action crosses above the 70 threshold of the indicator.
Uniswap Price Prediction: UNI/USDT Proceeds Northwards (4-Hour Chart)
On the 4-hour chart, Uniswap’s price activity has moved above the 9-day EMA line. The ongoing session remains green, suggesting that bullish forces are still in control.
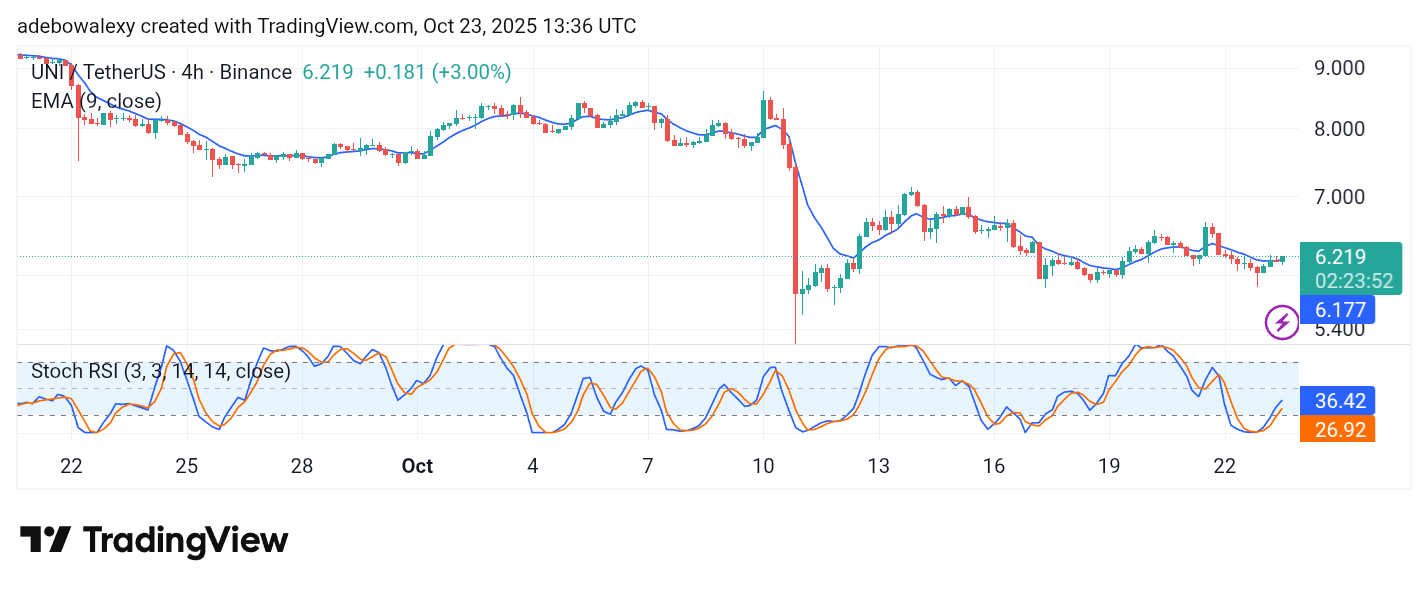
With the price already poking through the 9-day EMA curve, bullish traders may gain more confidence to stay active.
The SRSI indicator lines can be seen rising out of the oversold zone. However, the leading line of the indicator shows a slight curve at the tip, suggesting that long traders should stay cautious as downward forces may still taint the bullish outlook, especially around the $6.50 and $7.00 price levels.