Uniswap (UNI) Price Prediction: UNI/USDT Remains Sealed Below the $7.00 Mark
Estimated Reading Time: 3 minutes
Don’t invest unless you’re prepared to lose all the money you invest. This is a high-risk investment and you are unlikely to be protected if something goes wrong. Take 2 minutes to learn more

Date: October 16, 2025
The Uniswap token maintains a highly correlated market movement with Bitcoin. Consequently, since the sudden price crash that occurred in the crypto market, this token has also continued to struggle below key technical levels. Nevertheless, the ongoing downward retracement appears to be encountering some resistance at the moment. More details about the market are discussed below.
UNI/USDT Long-Term Trend — Bullish (Daily Chart)
Key Price Levels
Resistance: $7.00, $8.00, $9.00
Support: $6.50, $6.00, $5.50
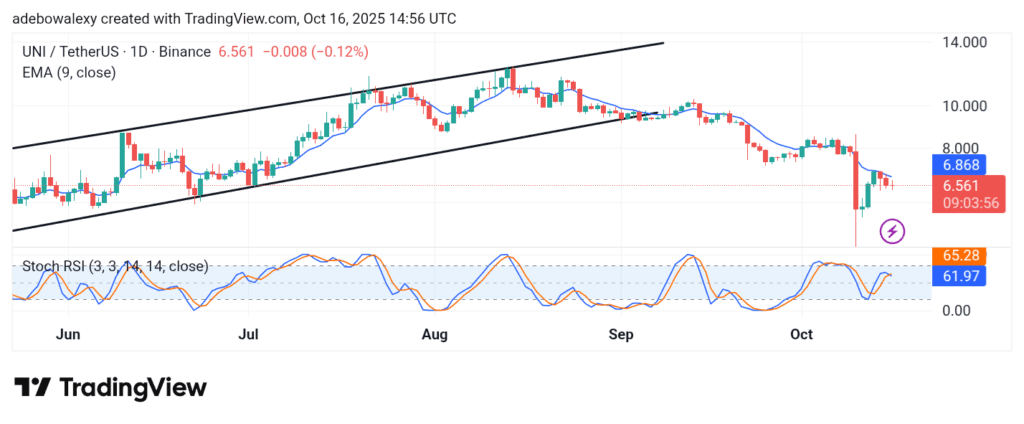
On the Uniswap daily chart, price activity can be seen rebounding off the resistance formed by the 9-day Exponential Moving Average (EMA) line. The noted downward retracement has persisted for three consecutive sessions, including the ongoing one. However, the latest price candle shows heavy contraction and thus takes the form of a Doji candle — a sign of market indecision.
Meanwhile, the Stochastic Relative Strength Index (SRSI) indicator has shown a downward crossover, although its lines still maintain a sideways trajectory for now, suggesting that bearish momentum is not yet fully established.
Uniswap Price Prediction: UNI/USDT Bears Still in Control
While the ongoing session in the Uniswap market suggests that bearish progress may be facing some rejection, bears still appear to be in control of the market. The most recent price candle, though contracted, remains positioned below the 9-day EMA curve. Its red appearance reinforces the notion that sellers continue to dominate.
Additionally, the SRSI indicator has already confirmed a downward crossover, though its lines have yet to begin a clear descent. This implies that bearish momentum is present but not fully developed. Therefore, the market remains inclined toward lower price levels in the near term.
Uniswap Price Prediction: UNI/USDT Continues to Consolidate Above $6.50 (4-Hour Chart)
On the 4-hour chart, Uniswap’s price activity provides a clearer view of the ongoing struggle within the market. Price movement has been proceeding largely sideways, hovering just above the $6.50 level for some time. This consolidation occurs below the 9-day EMA curve, indicating subdued momentum.
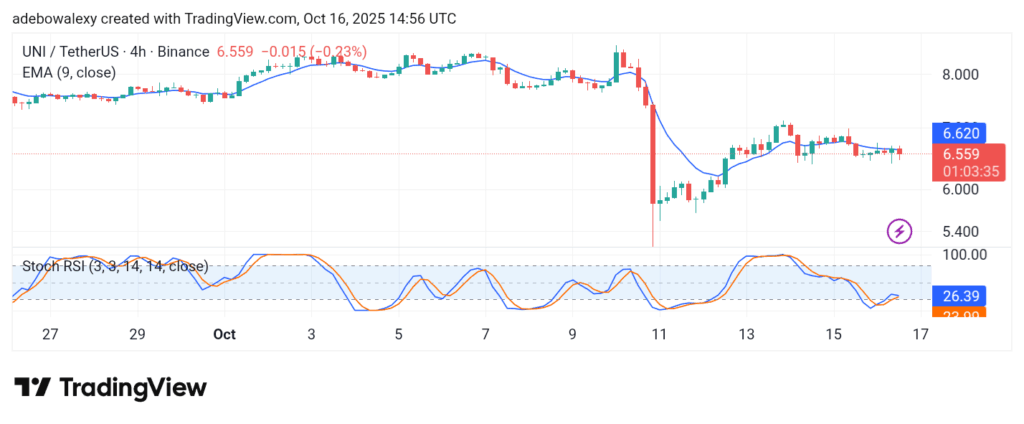
The latest price candle shows that the market is edging slightly toward the $6.50 mark, reflecting a flat trading phase. The SRSI indicator lines are converging while maintaining a slight upward slope just above the 20 level, suggesting mild recovery potential. However, the overall setup still hints that price action could descend toward the $6.00 level if bullish support weakens.