Tamadoge (TAMA/USD) Exhibits Stronger Bullish Sentiment Near $0.008 Amidst Persistent Selling Pressure
Estimated Reading Time: 3 minutes
Don’t invest unless you’re prepared to lose all the money you invest. This is a high-risk investment and you are unlikely to be protected if something goes wrong. Take 2 minutes to learn more
The $0.008 price level holds immense significance as TAMA/USD endeavors to establish a bullish market trajectory. The Bulls have launched multiple rallying attempts from this level. Coupled with the emergence of several higher support levels and a steady resistance point at $0.009, there was a reasonable expectation for the market to breach the $0.009 resistance. Indeed, the resistance was breached; however, the bull market’s sustainability above this level proved short-lived, leading to a subsequent decline below $0.009.
Key Levels
- Resistance: $0.013, $0.014, and $0.015.
- Support: $0.00800, $0.0075, and $0.0073.
TAMA/USD Price Analysis: The Indicators’ Point of View
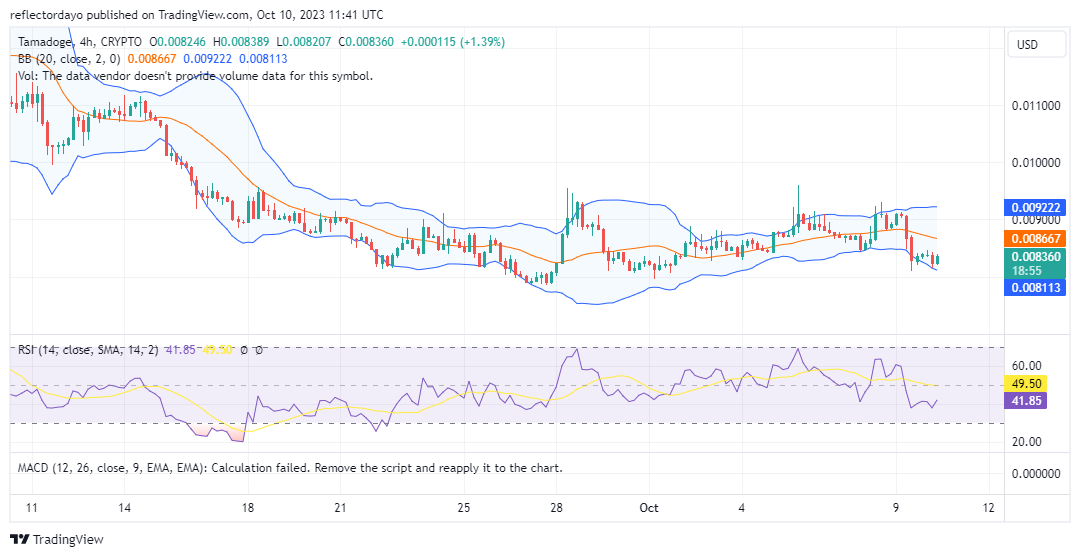
TAMA/USD initially breached the $0.009 price zone on October 8th. However, the market within this price range mostly exhibited a notably stagnant trend, indicating a deadlock between bullish and bearish forces at this level. This prolonged stalemate eventually triggered a substantial bearish movement, driving the market toward the $0.008 mark. This $0.008 level serves as a critical last line of defense, and it is currently witnessing renewed bullish interest, with bulls regrouping around this support.
The Relative Strength Index (RSI) indicates that the market is hovering around the 41 level. This suggests that, despite the bearish range, bulls are actively defending their position against the bears, indicating their resilience. Additionally, a resistance level appears to have formed in close proximity to $0.008, but bulls are making determined efforts to overcome this resistance.

Tamadoge Short-Term Outlook: 1-Hour Chart
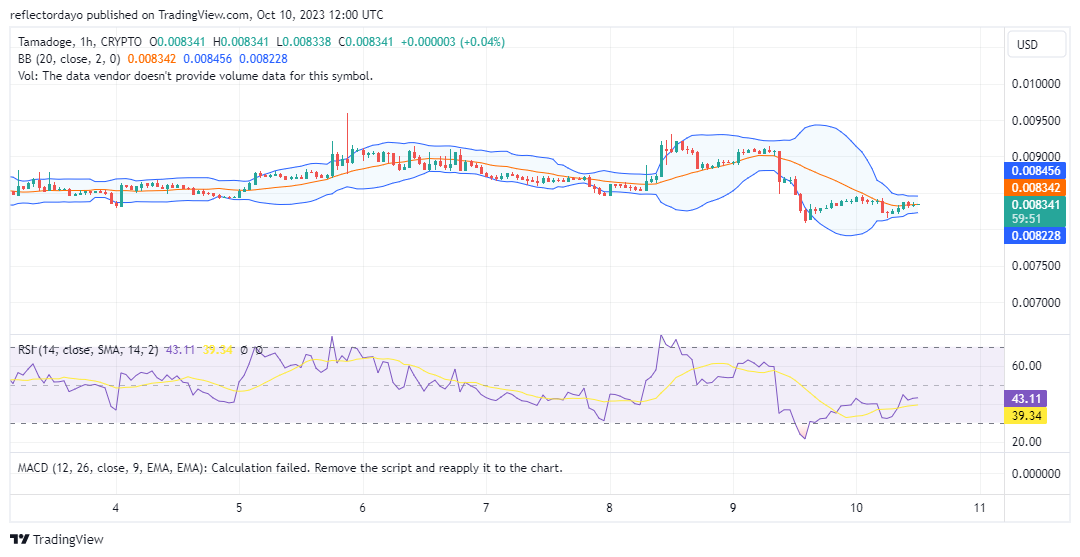
In the 1-hour Bollinger Bands chart, the market’s trajectory closely aligns with the 20-day moving average. This alignment indicates that, from the perspective of the Bollinger Bands indicator, the price currently resides in a state of equilibrium, positioned between bullish and bearish sentiment. Consequently, the Bollinger Bands themselves have converged around the price, signifying an impending price breakout.
Simultaneously, the Relative Strength Index (RSI) records a range of approximately 42, indicating a period of consolidation and relative stability in the market. Presently, there appears to be a decrease in volatility, suggesting that a significant price movement may be imminent.
Play and earn Tamadoge tokens.
Take down those critters, earn that $TAMA 💪
Join the action with Tamadoge Arena on mobile👇
📱 Android: https://t.co/INCaGendE4
📱 iOS: https://t.co/Fj9tT5Oicu pic.twitter.com/1q9OXPnrot— TAMADOGE (@Tamadogecoin) October 9, 2023
Do you want a coin that will be 100 times more valuable in the next few months? That is Tamadoge. Buy TAMA today!