Wall Street Memes (WSM) Price Affirms a Base, Holding Hikes
Estimated Reading Time: 3 minutes
Don’t invest unless you’re prepared to lose all the money you invest. This is a high-risk investment and you are unlikely to be protected if something goes wrong. Take 2 minutes to learn more

Wall Street Memes Price Prediction – February 23
As there have been a continuity in the way that ups and downs have persistently featuring a systemic manner in the operations of Wall Street Memes coin versus the market valuation of the US Dollar, bulls have been optimistically putting all it requires to stay relevant, given that crypto trade now affirms a base, holding hikes.
Several trade lines formed around the lower Bollinger Band have now positioned above the key underlying support at $0.001. This indicates that whenever the price shifts downward, long-term investors will have opportunities to initiate fresh long positions, maximizing potential gains as the price is poised for an imminent upward reversal.
WSM/USD Market
Key Levels
Resistance levels: $0.002, $0.0025, $0.003
Support levels: $0.001, $0.0008, $0.0006
WSM/USD – 4-hour Chart
The medium-term chart (4-hour chart) of the WSM/USD trade affirms a base above $0.001, holding hikes in inputs around the lower indicator.
The positioning arrangement of the Bollinger Bands indicators shows efforts to create a trade environment for securing strong buying entry points. The stochastic oscillators have swiftly moved northward into the overbought region, signaling that forces in the medium-term mode are tentatively decreasing.
Should WSM/USD market buyers wait for a while, considering the current positioning of the indicators?
Due to the delay in how bulls have been gradually adding momentum, the indicators are signaling exhaustion in the direction they have been heading. However, given that the WSM/USD market is currently establishing a base, holding hikes in inputs, buying options should be prioritized over other trade sentiments.
Traders entering the WSM/USD market may begin placing long positions, regardless of the current indicator signals, as the market remains undervalued. Increasing position sizes could provide long-term profit opportunities for WSM/USD investors.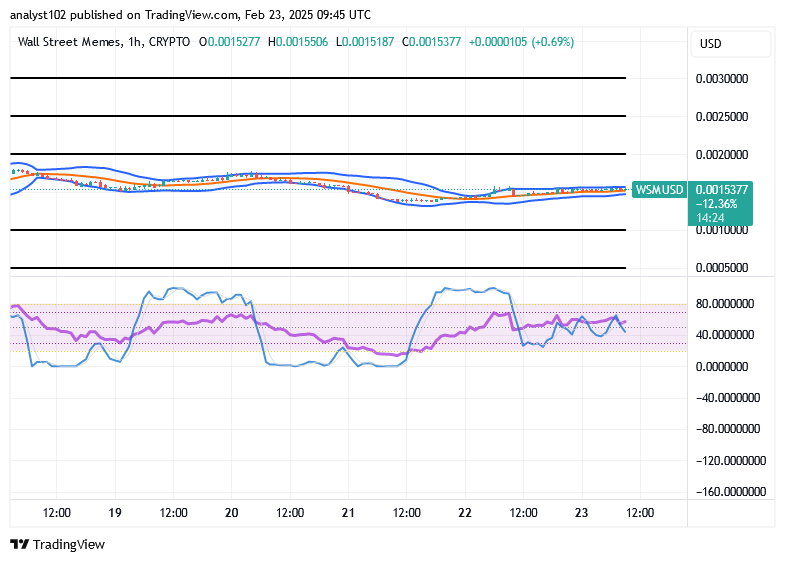
WSM/USD 1-hour chart
The 1-hour chart from the technical picture of the short-term setup shows that the WSM/USD market presently affirms a base, holding hikes in inputs.
The Bollinger Bands indicators are currently displaying a trend that encapsulates the candlestick formation, signaling that a range-bound movement has been established in the price action as of this analysis. The stochastic oscillators are trending sideways, with their movements stabilizing, confirming the ongoing consolidation. Despite this, our recommendation remains to continue with buying positions.
You must conquer the Hunger Games to retire comfortably.
— Wall Street Memes (@wallstmemes) February 22, 2025
Buy and stake WSM now!: Wall Street Meme (WSM)