Ethereum (ETH/USDT) Faces More Bearish Pressure
Estimated Reading Time: 3 minutes
Don’t invest unless you’re prepared to lose all the money you invest. This is a high-risk investment and you are unlikely to be protected if something goes wrong. Take 2 minutes to learn more
Ethereum Long-term Analysis: Bearish
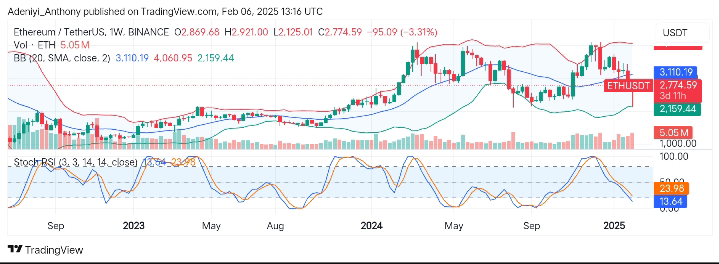
Ethereum against the Tether on a weekly timeframe has seen a massive drop, with the current market indicating a retracement after a failed attempt at higher resistance zones.
The indicators on the chart show the pair is on a downtrend after reaching a peak attained in 2024, as the weekly candle closes below the middle Bollinger band. This suggests further bearish continuation as volume shows no significant spike with the bears regaining control of the market.
Currently, Ethereum trades at $2,774.59 with more than a 3% dip in the price level for the week.
Technical Indicators
Major Resistance Levels: $3,110.19, $3,400.00, and $4,060.95
Major Support Levels: $2,125.01, $2,159.44, and $1,850.00
Ethereum Technical Analysis
The analysis of the market for Ethereum is currently under short-term bearish pressure. The chart above indicates a strong downtrend after a significant pullback. However, the position of the price below the lower Bollinger band signals the presence of strong selling pressure, and a break below the $2,159.44 could trigger more aggressive sell-offs.
On the other hand, the Stochastic RSI stretches downward, further displaying momentum towards the south as the lines read values below the 30-mark level. To this end, $3,110.19 and $2,159.44 serve as the critical level; as a break above the former would mean the end of the current trend, while a break below the latter would indicate a further downtrend.
ETH/USDT Analysis: Where from Here?
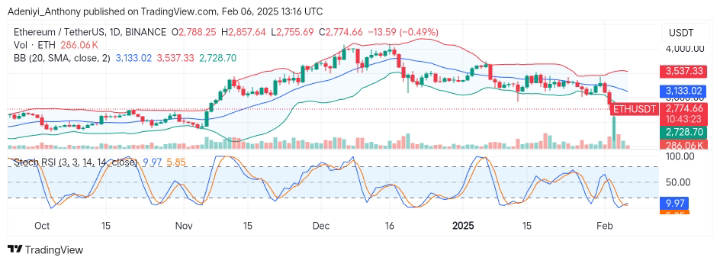
On the daily timeframe, the ETH/USDT chart reveals a short-term bearish trend, with the price falling below the Dynamic 20-day simple moving average. The candlestick structure shows strong bearish dominance, as the price approaches the lower Bollinger band. To this end, a break below $2,728.70 would suggest further movement to lower support levels.
On the other hand, the Stochastic oscillator suggests the pair is deeply oversold, with the values of the lines at 9.97 and 5.85 respectively. This signals a potential reversal might be on the horizon. To this end, an improvement in the values of the lines and the placement of the price above $3,133 in the near term would determine this reversal.
You can purchase crypto coins here. Buy LBlock